How to Measure Employer Reputation: A Framework for Global Employers

Search for employer branding metrics and you will find lists. Eleven metrics, seventeen metrics, ten metrics to guide your efforts. Most mix three different things: activity metrics that describe what the team did (followers, page views, content output), funnel metrics that describe what happened next (applications, cost per hire, offer acceptance) and a thin layer of perception metrics, usually a review-site rating and an occasional survey.
None of the lists gives a benchmark. None separates the brand's output from the market's perception. None reads by country or by function. For a team running employer brand in one market with one careers site, that may be fine. For a global employer with regional teams and a leadership audience that wants to know whether reputation is improving, it is not a measurement framework. It is a dashboard of things that are easy to count.
This page sets out how PerceptionX measures employer reputation, what the signals mean, how they are cut, what "good" looks like, and how to run measurement so that it can show change.
First, separate three layers
Before choosing metrics, be clear about what each one measures.
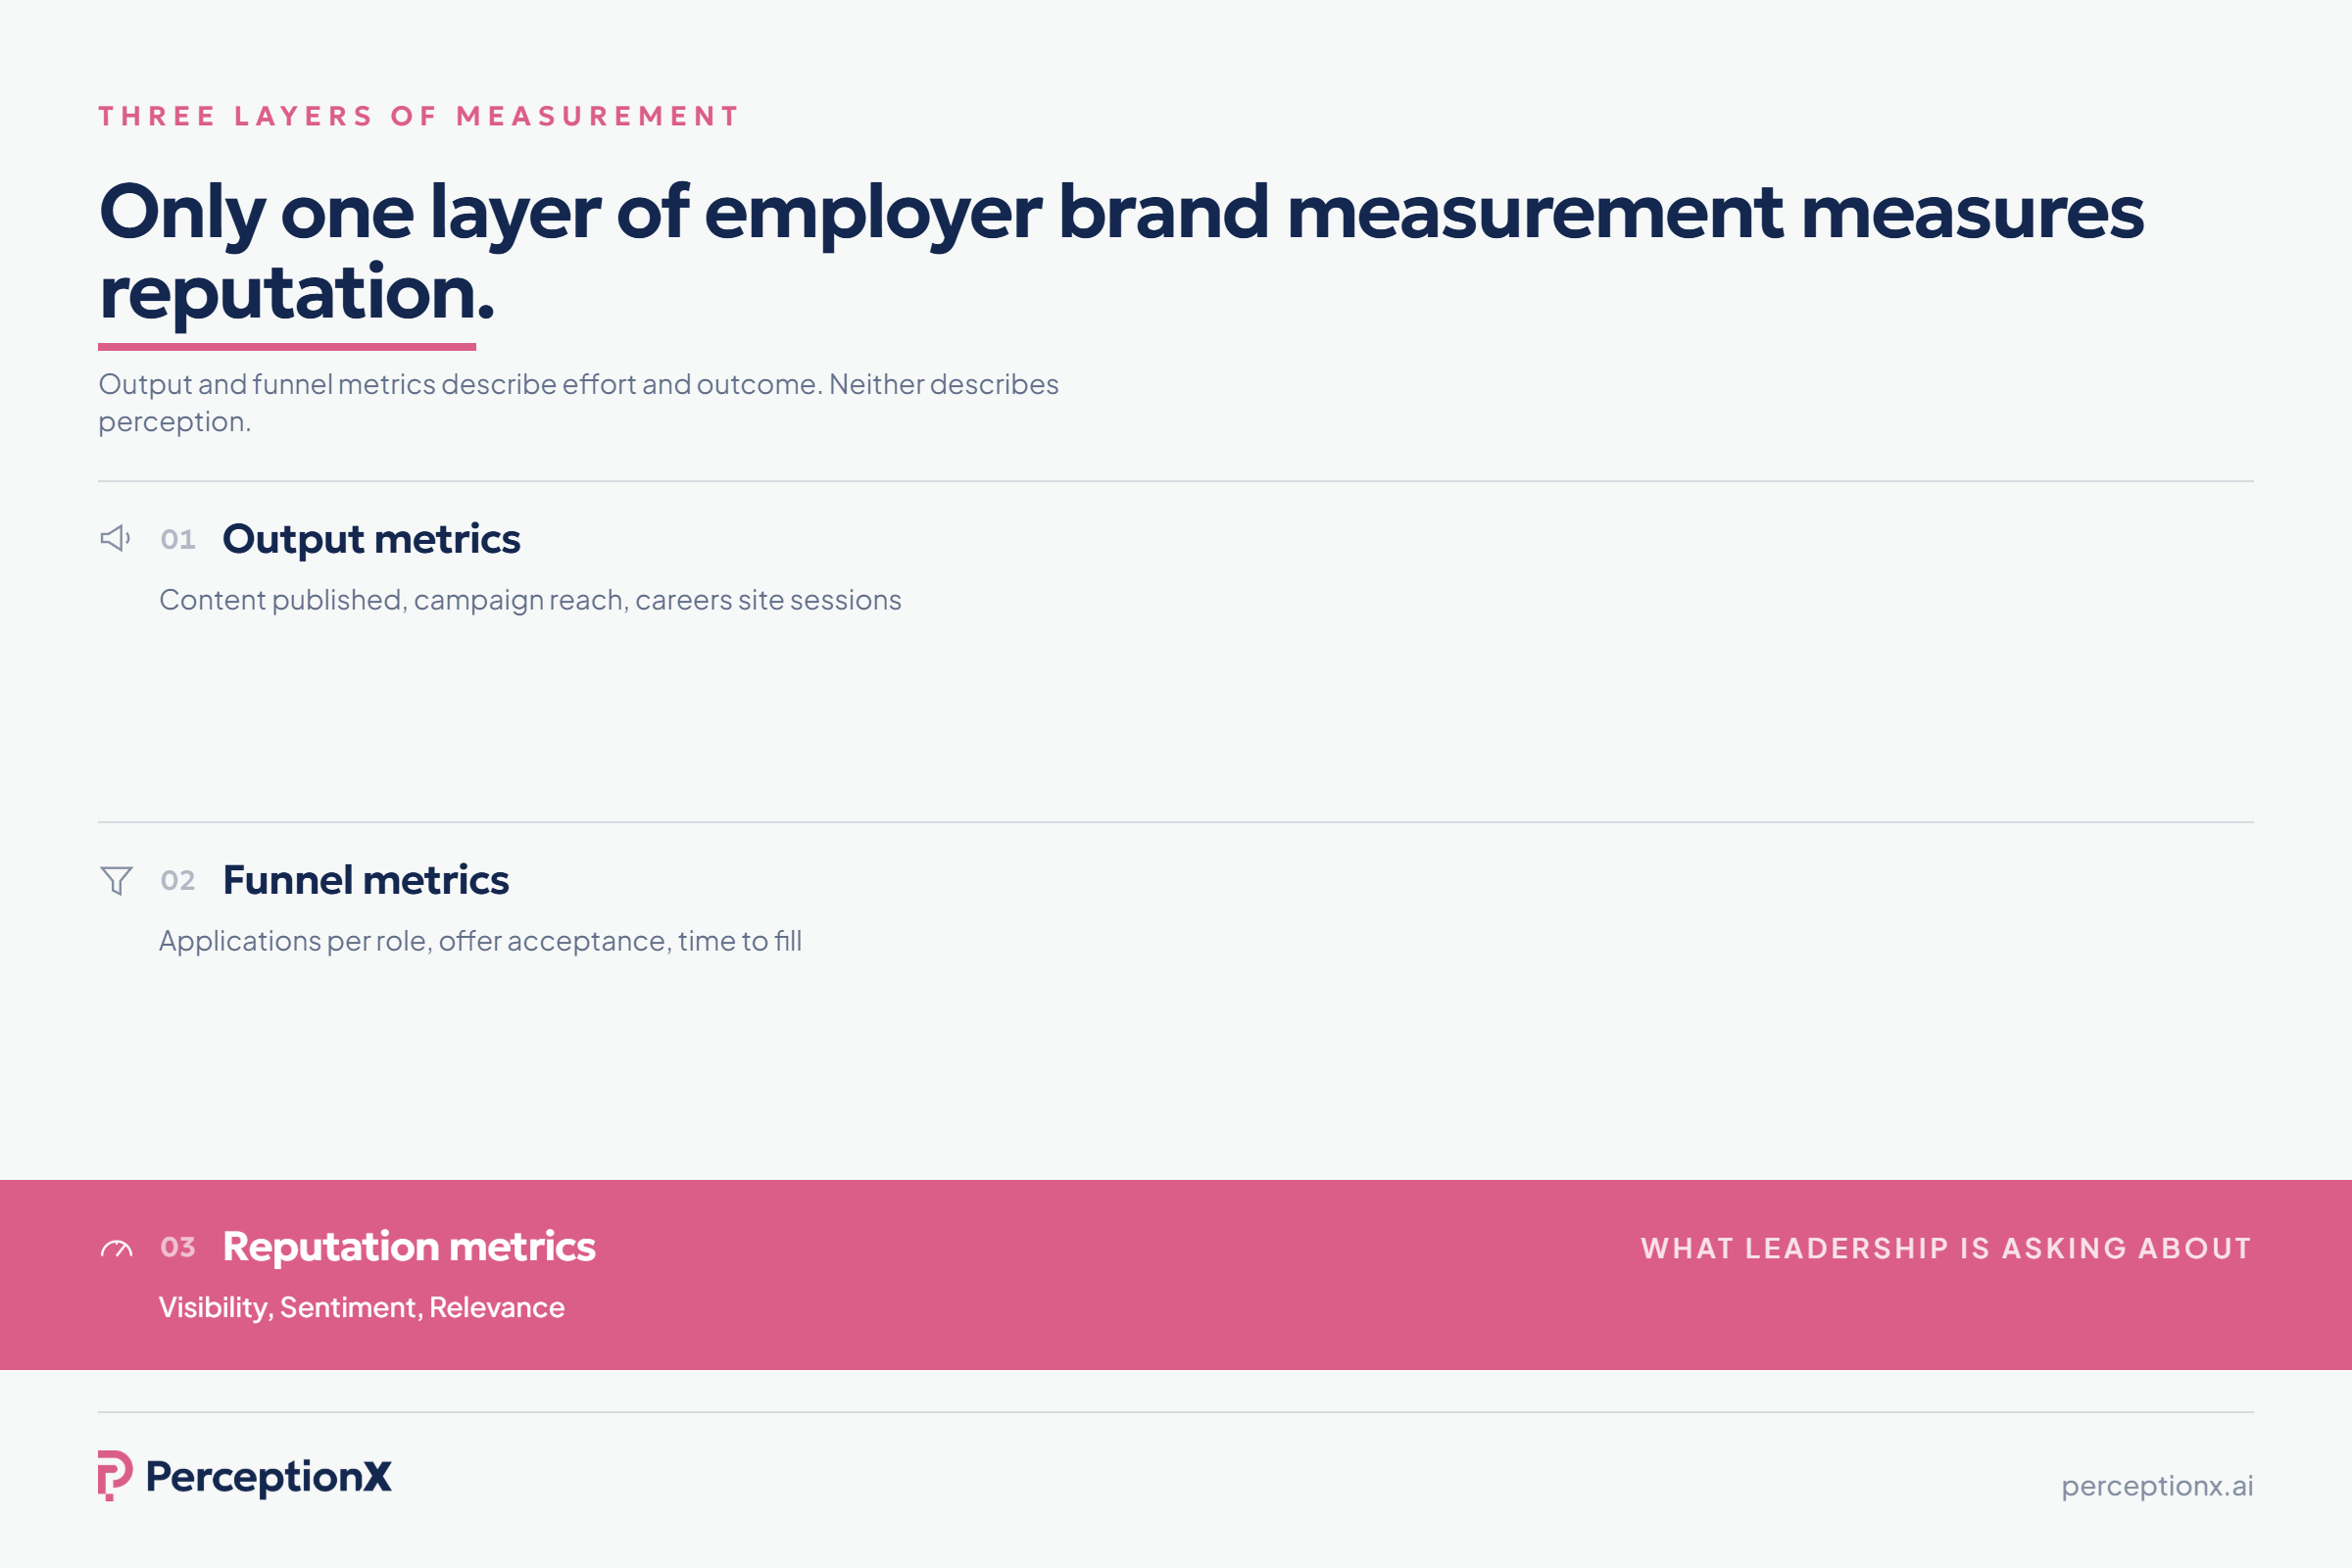
Output metrics describe the employer brand programme: content published, campaign reach, careers site sessions, social following, video views. They tell you the programme is running. They do not tell you what anyone believes.
Funnel metrics describe recruiting outcomes: applications per role, source of hire, time to fill, offer acceptance, quality of hire. They are influenced by reputation, and by many other things: compensation bands, requisition volume, recruiter capacity, market conditions. Attributing a funnel movement to reputation is guesswork unless reputation is measured on its own.
Reputation metrics describe what the market perceives. This is the layer most frameworks skip, because it is the hardest to measure without a panel survey, and panel surveys are expensive, annual and national.
A measurement framework needs all three layers, but only the third answers the question leadership is asking.
The three signals
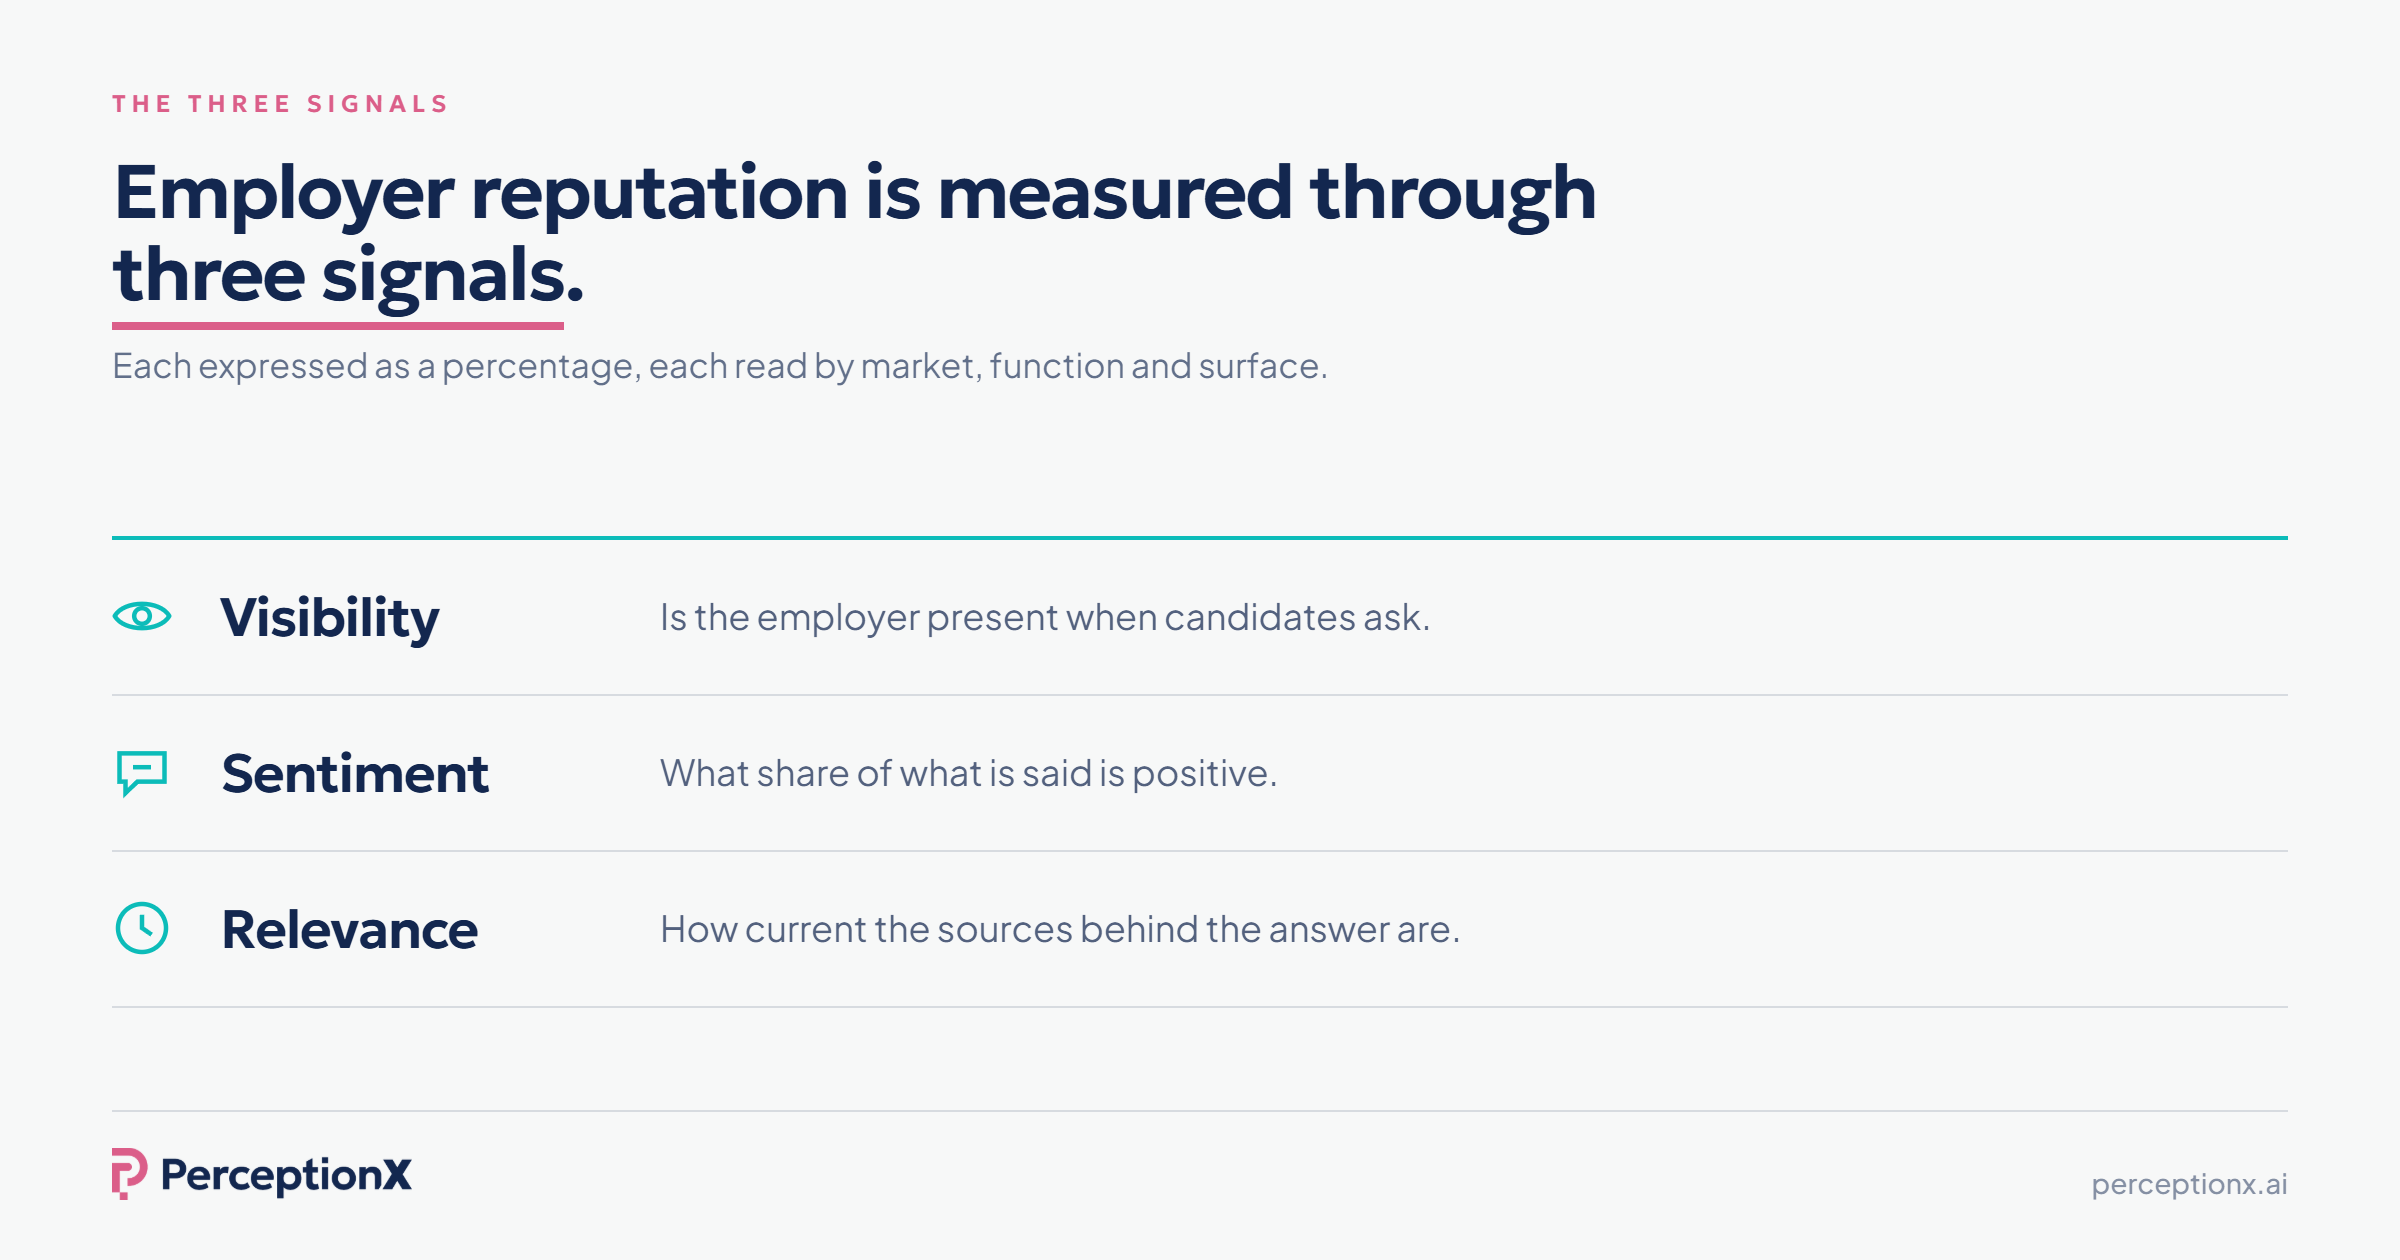
PerceptionX measures employer reputation through three signals, each expressed as a percentage.
Visibility. When candidates ask the questions they actually ask, does the employer appear? The questions are not "tell me about Company X". They are "which companies are hiring data engineers in Munich", "is Company X a good place to work in sales", "compare Company X and Company Y for early-career finance roles". Visibility is the share of relevant answers in which the employer is mentioned. An employer that is absent has no reputation to manage on that surface, and that is a finding in itself.
Sentiment. Of the themes raised about the employer in those answers, what share is positive? This is calculated as positive themes divided by total themes, and always stated as "X% sentiment". It is not a net score and it is not a plus-or-minus scale, because those framings hide the mix. An employer at 70% sentiment with the negative 30% concentrated on one attribute in one market has a different problem from an employer at 70% with negativity spread evenly.
Relevance. How current are the sources the answers are built on? AI assistants synthesise what they can find, and what they find is often old. An employer described from a three-year-old press cycle and review pages nobody has updated is being described by a version of itself that no longer exists. Relevance is the freshness of the evidence behind the answer, expressed as a score from 0 to 100.
The three signals combine into a composite Employer Perception Score, weighted 50% Sentiment, 30% Visibility, 20% Relevance. The weighting reflects a judgement: how the employer is described matters most, whether it is present matters next, and whether the description rests on current evidence completes the picture.
The six cuts
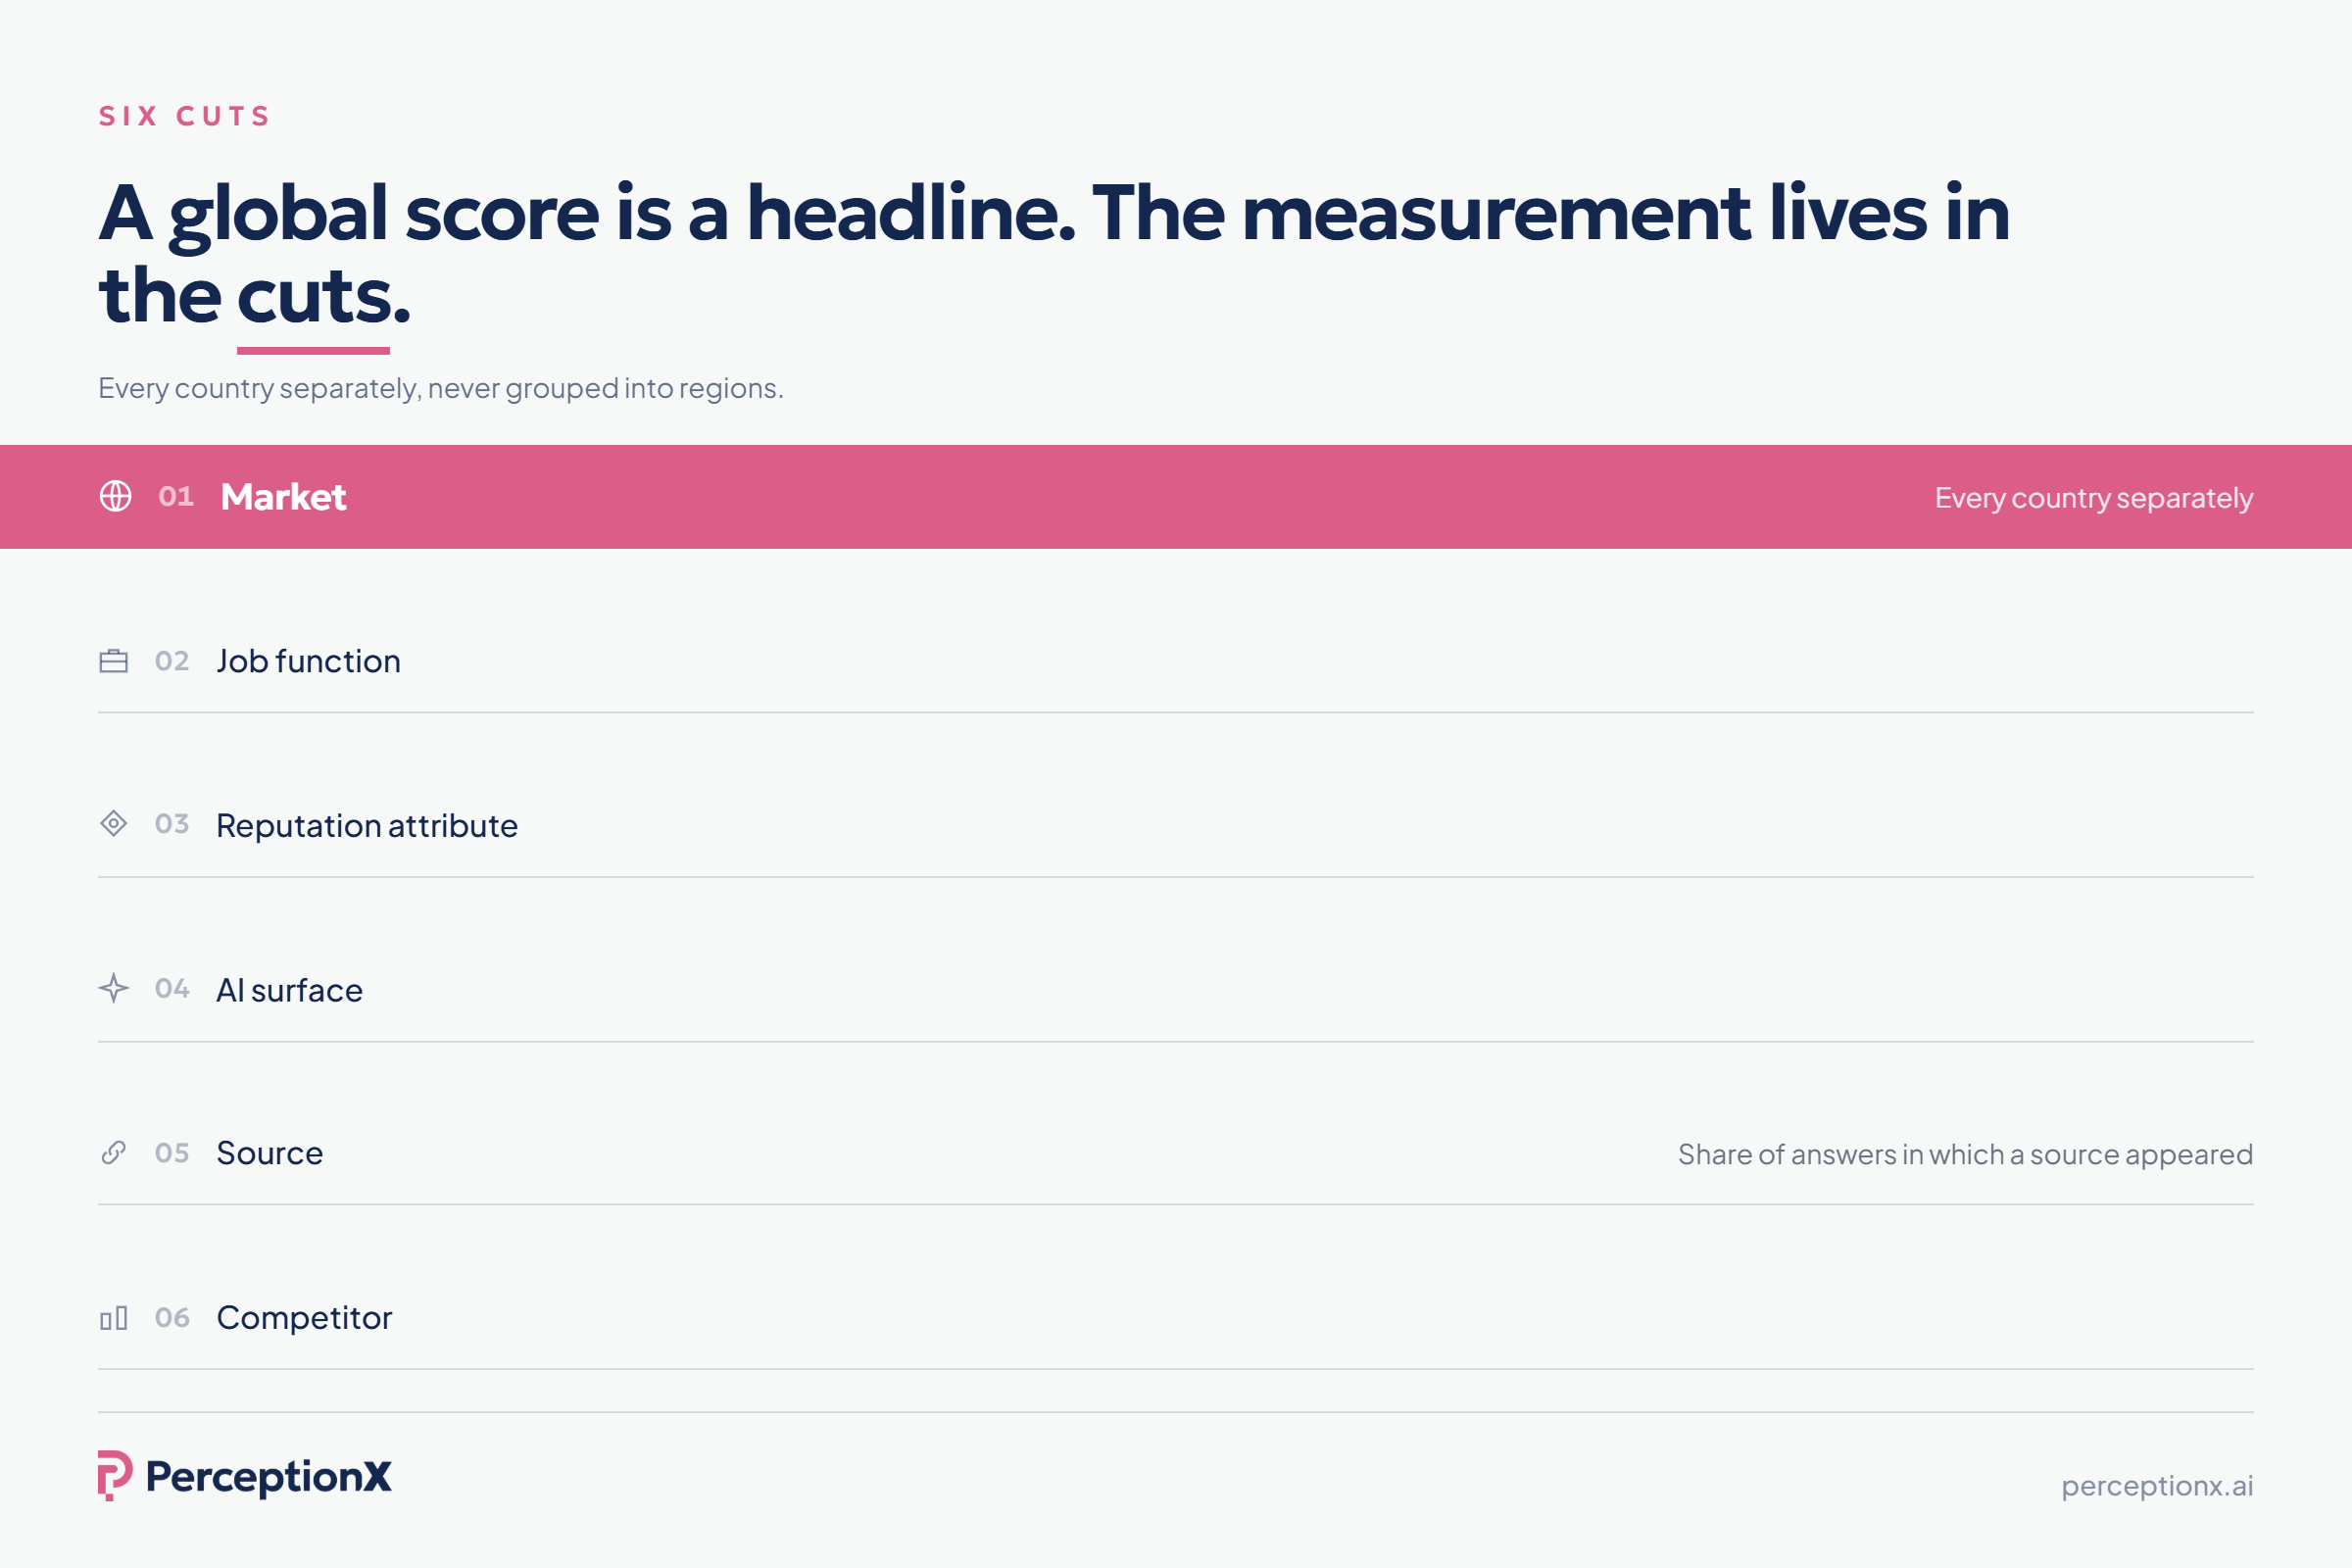
A global score is a headline. The measurement lives in the cuts.
By market. Every country separately. Never regional groupings, because a regional average is an average of markets that do not share sources, competitors or language, and it will hide the one market that is dragging the number.
By job function. Engineering, sales, finance, nursing, operations and so on. The same employer holds different reputations by function because the sources differ and the attributes weighed differ.
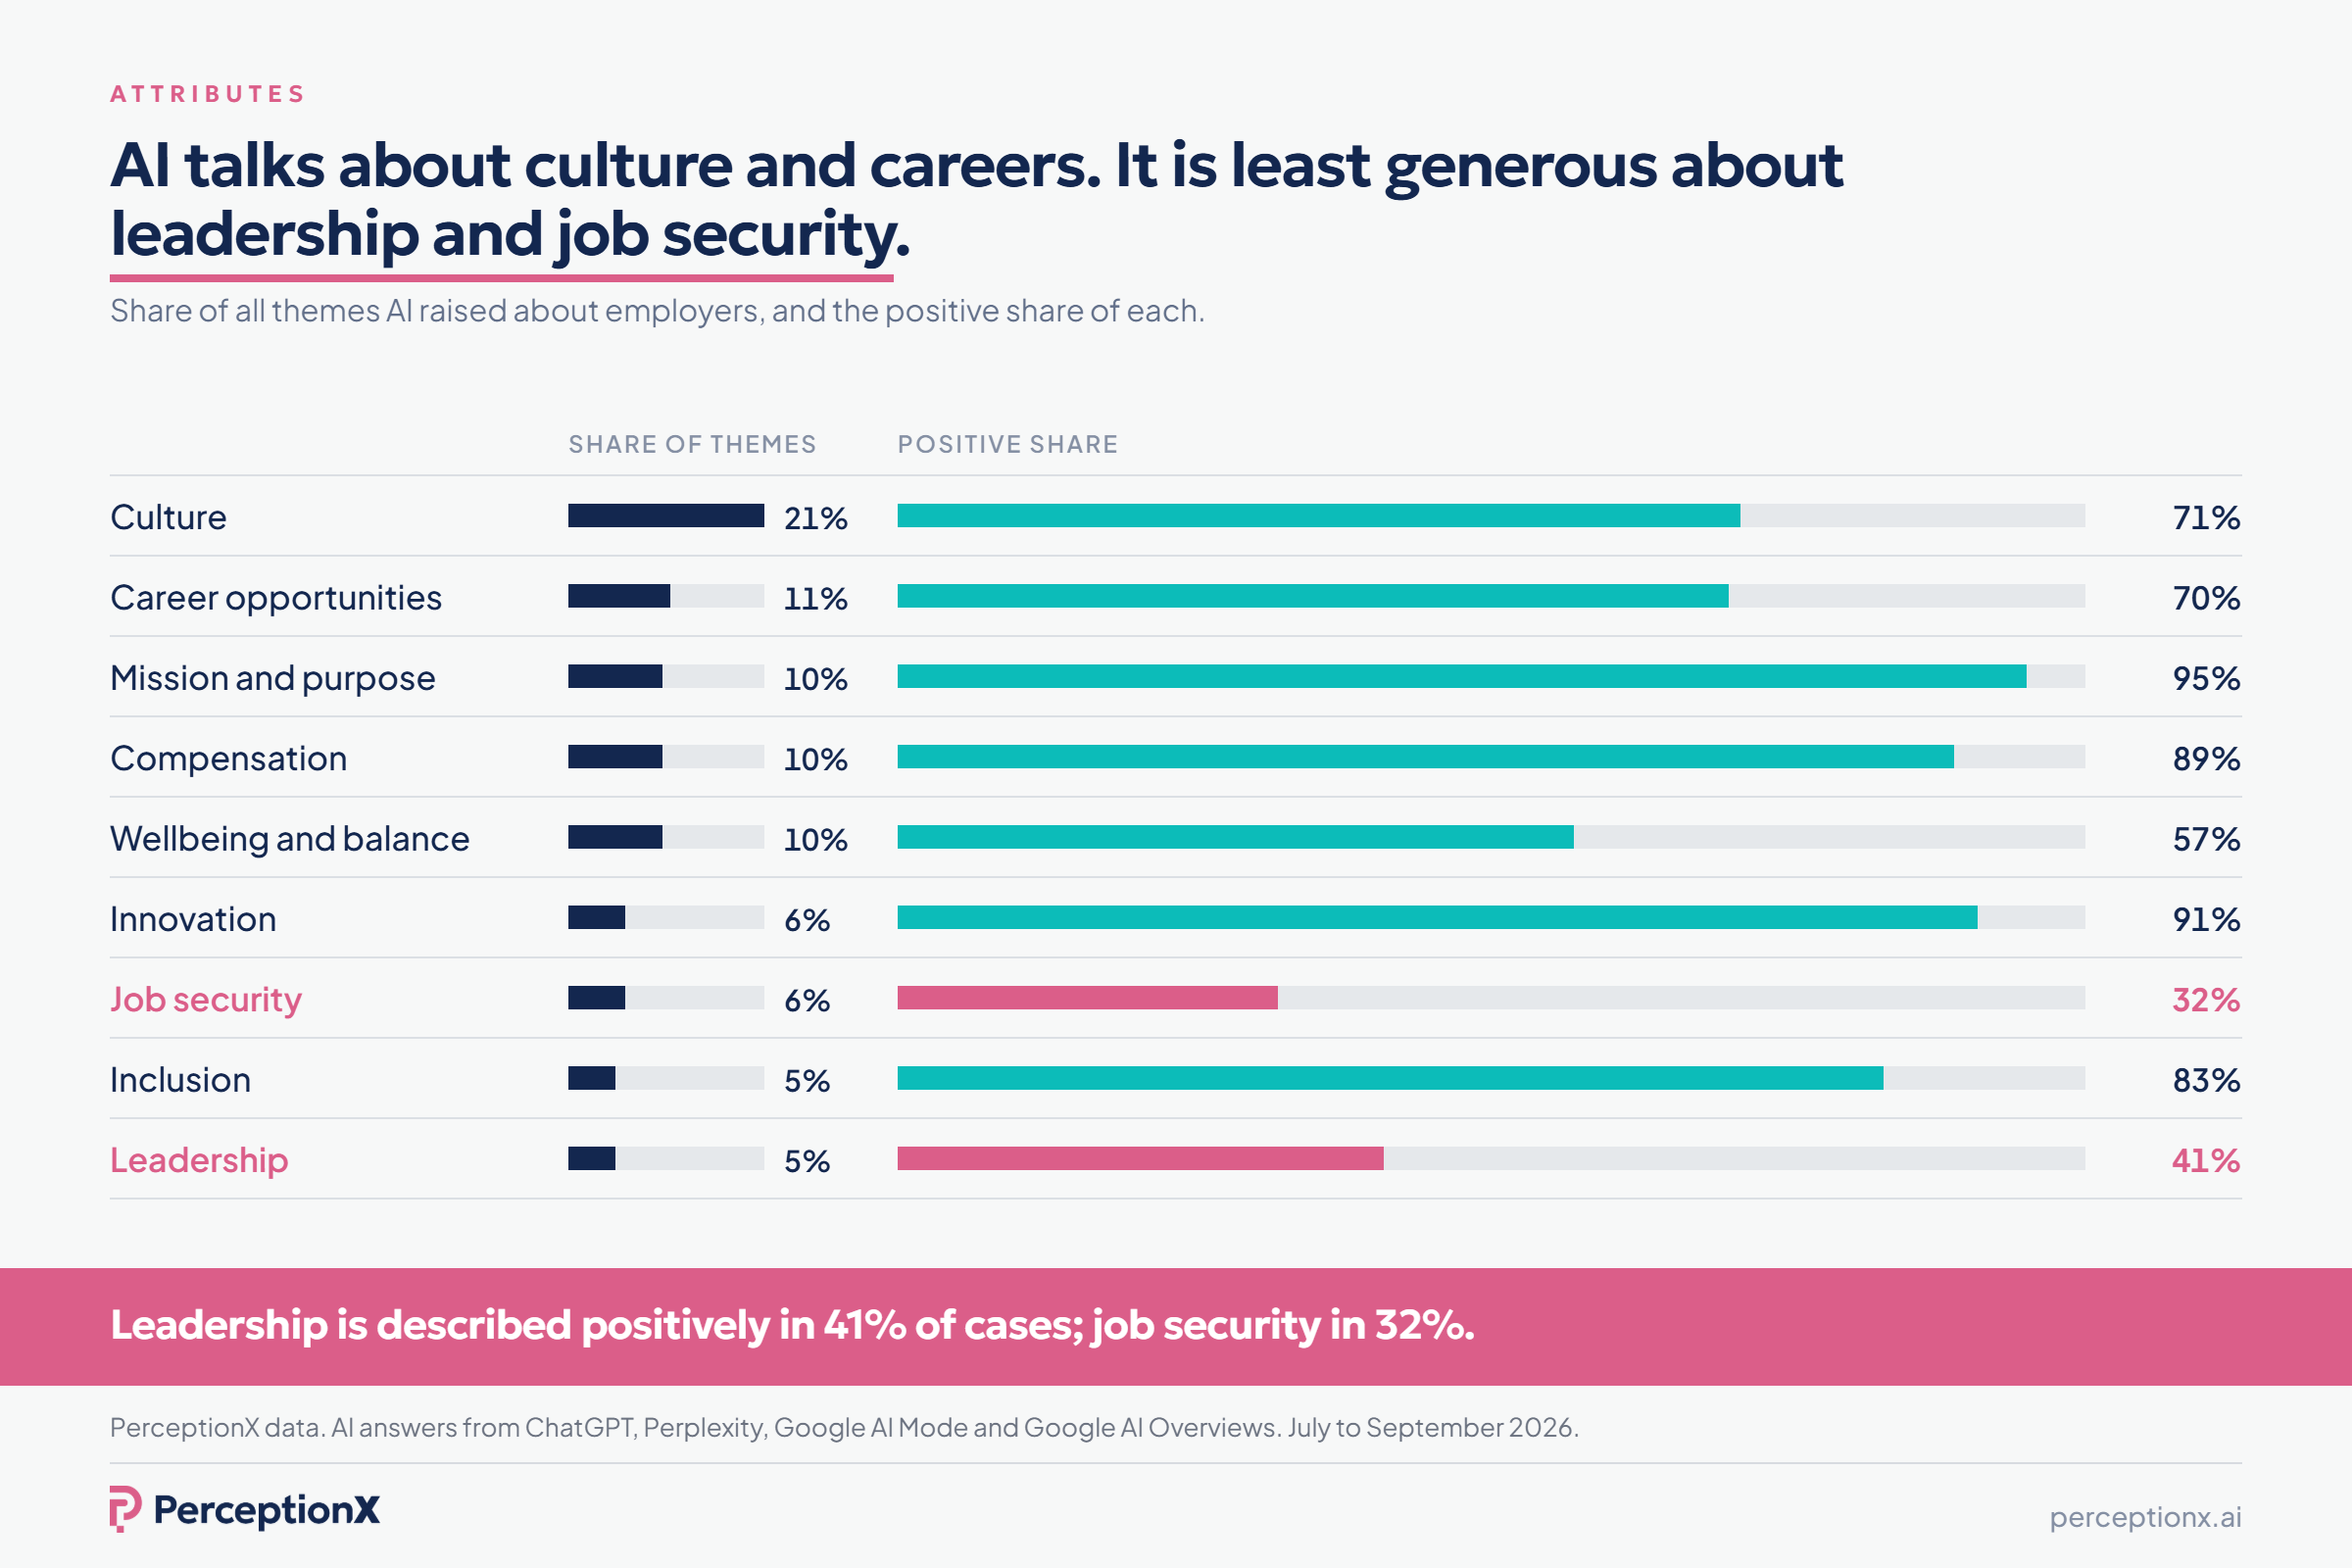
By reputation attribute. Every theme in every answer is classified against thirteen attributes: company culture, career opportunities, mission and purpose, compensation, wellbeing and balance, interview experience, innovation, job security, inclusion, leadership, application communication, onboarding and candidate feedback. The cut shows which attributes dominate the answers about an employer, and how each is described. This is where EVP validation happens: the EVP claims a set of attributes, the attribute cut shows which of them the market actually associates with the employer and whether the association is positive.
Across all employers tracked between July and September 2026, culture accounted for 21% of everything AI said about employers and career opportunities for 11%; those two attributes are what candidates mostly get told about. Mission and purpose (95% sentiment), innovation (91%) and compensation (89%) were described almost uniformly well. Wellbeing and balance sat at 57%, leadership at 41% and job security at 32%. If an EVP leads with leadership or stability, the attribute cut is where it finds out whether anyone believes it.
By AI surface. ChatGPT, Perplexity, Google AI Mode and Google AI Overviews. They draw on different sources and summarise differently. An employer that is well described on one and absent on another needs to know which candidates use which.
By source. Which sources appear in the answers about the employer, expressed as the share of answers in which each source appeared. This is the diagnostic cut. If sentiment in one market is being shaped by a specific class of source, the intervention is targeted. If the employer is absent because the sources AI trusts do not mention it, the intervention is different again. Source prominence is always expressed as coverage, the share of answers in which a source appeared, and never as a share of citations.
By competitor. Against a named set of talent competitors, per market. This is the cut leadership asks for. "Are we improving" is a weaker question than "are we closing the gap with the two companies we lose offers to in Poland".
What good looks like
A framework without benchmarks invites the wrong question: is 62% sentiment good? The answer depends on the market, the function and the competitor set. Even so, distributions help.
Across the employers PerceptionX tracked between July and September 2026, the spread looked like this.
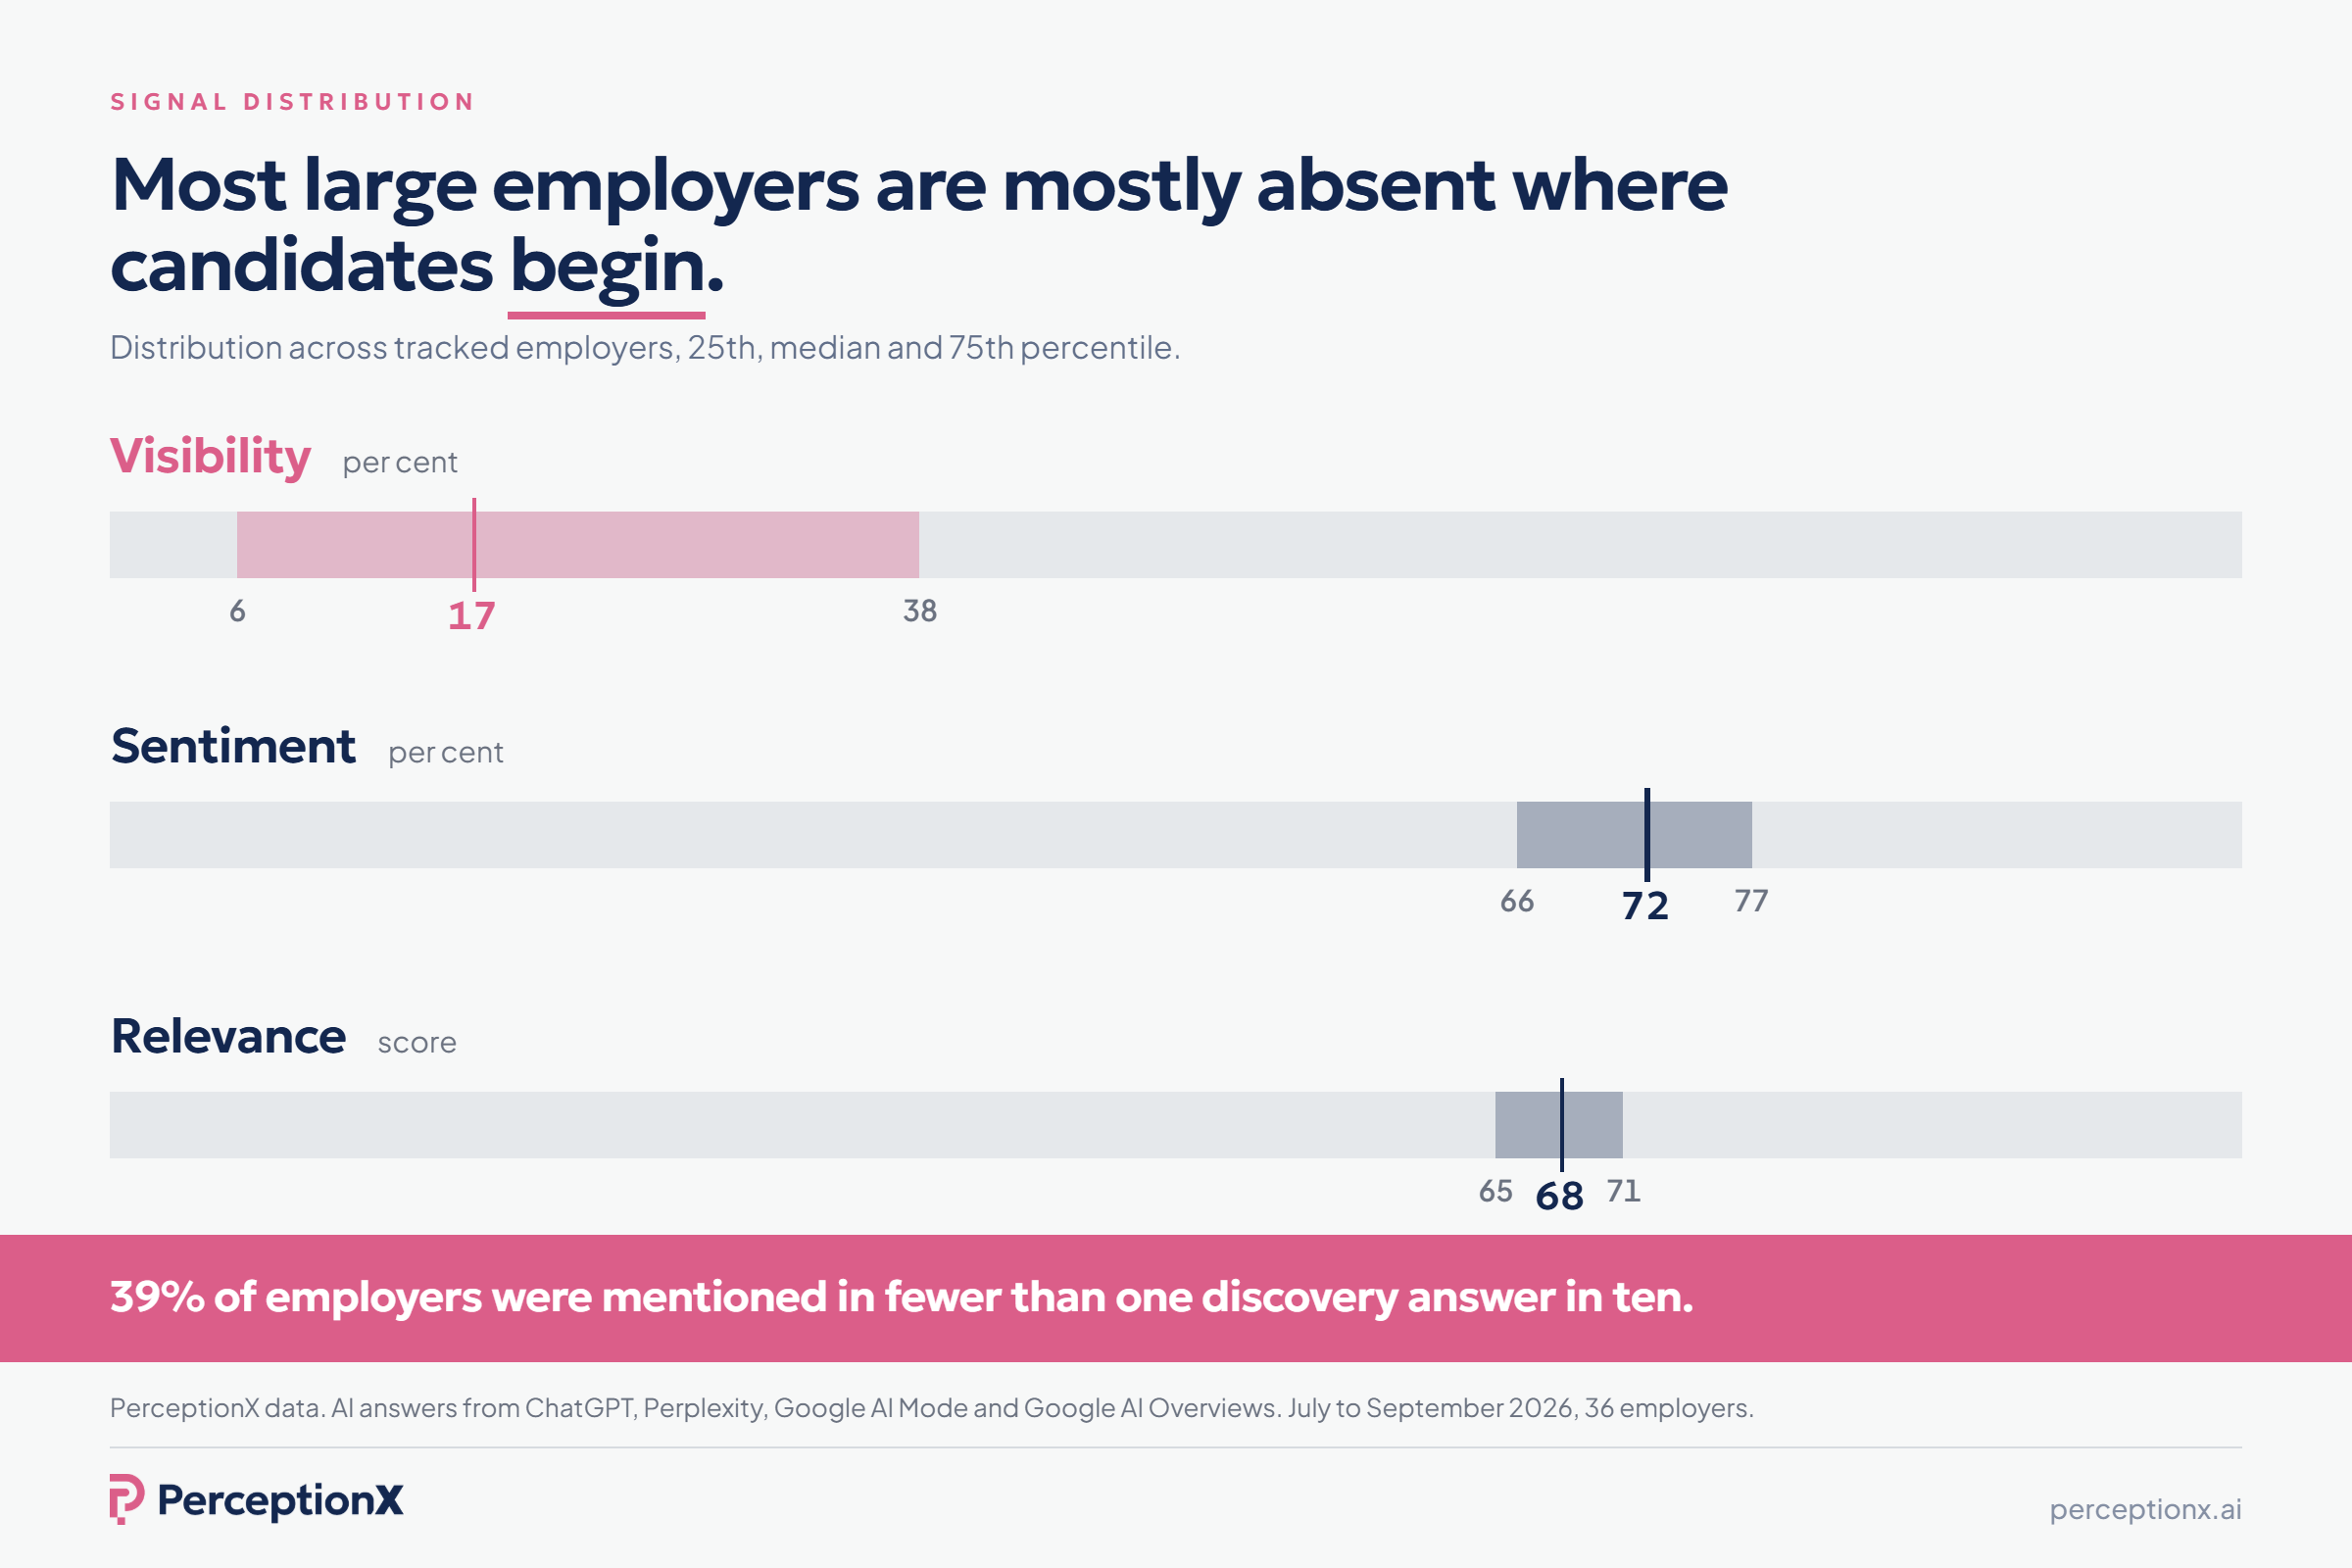
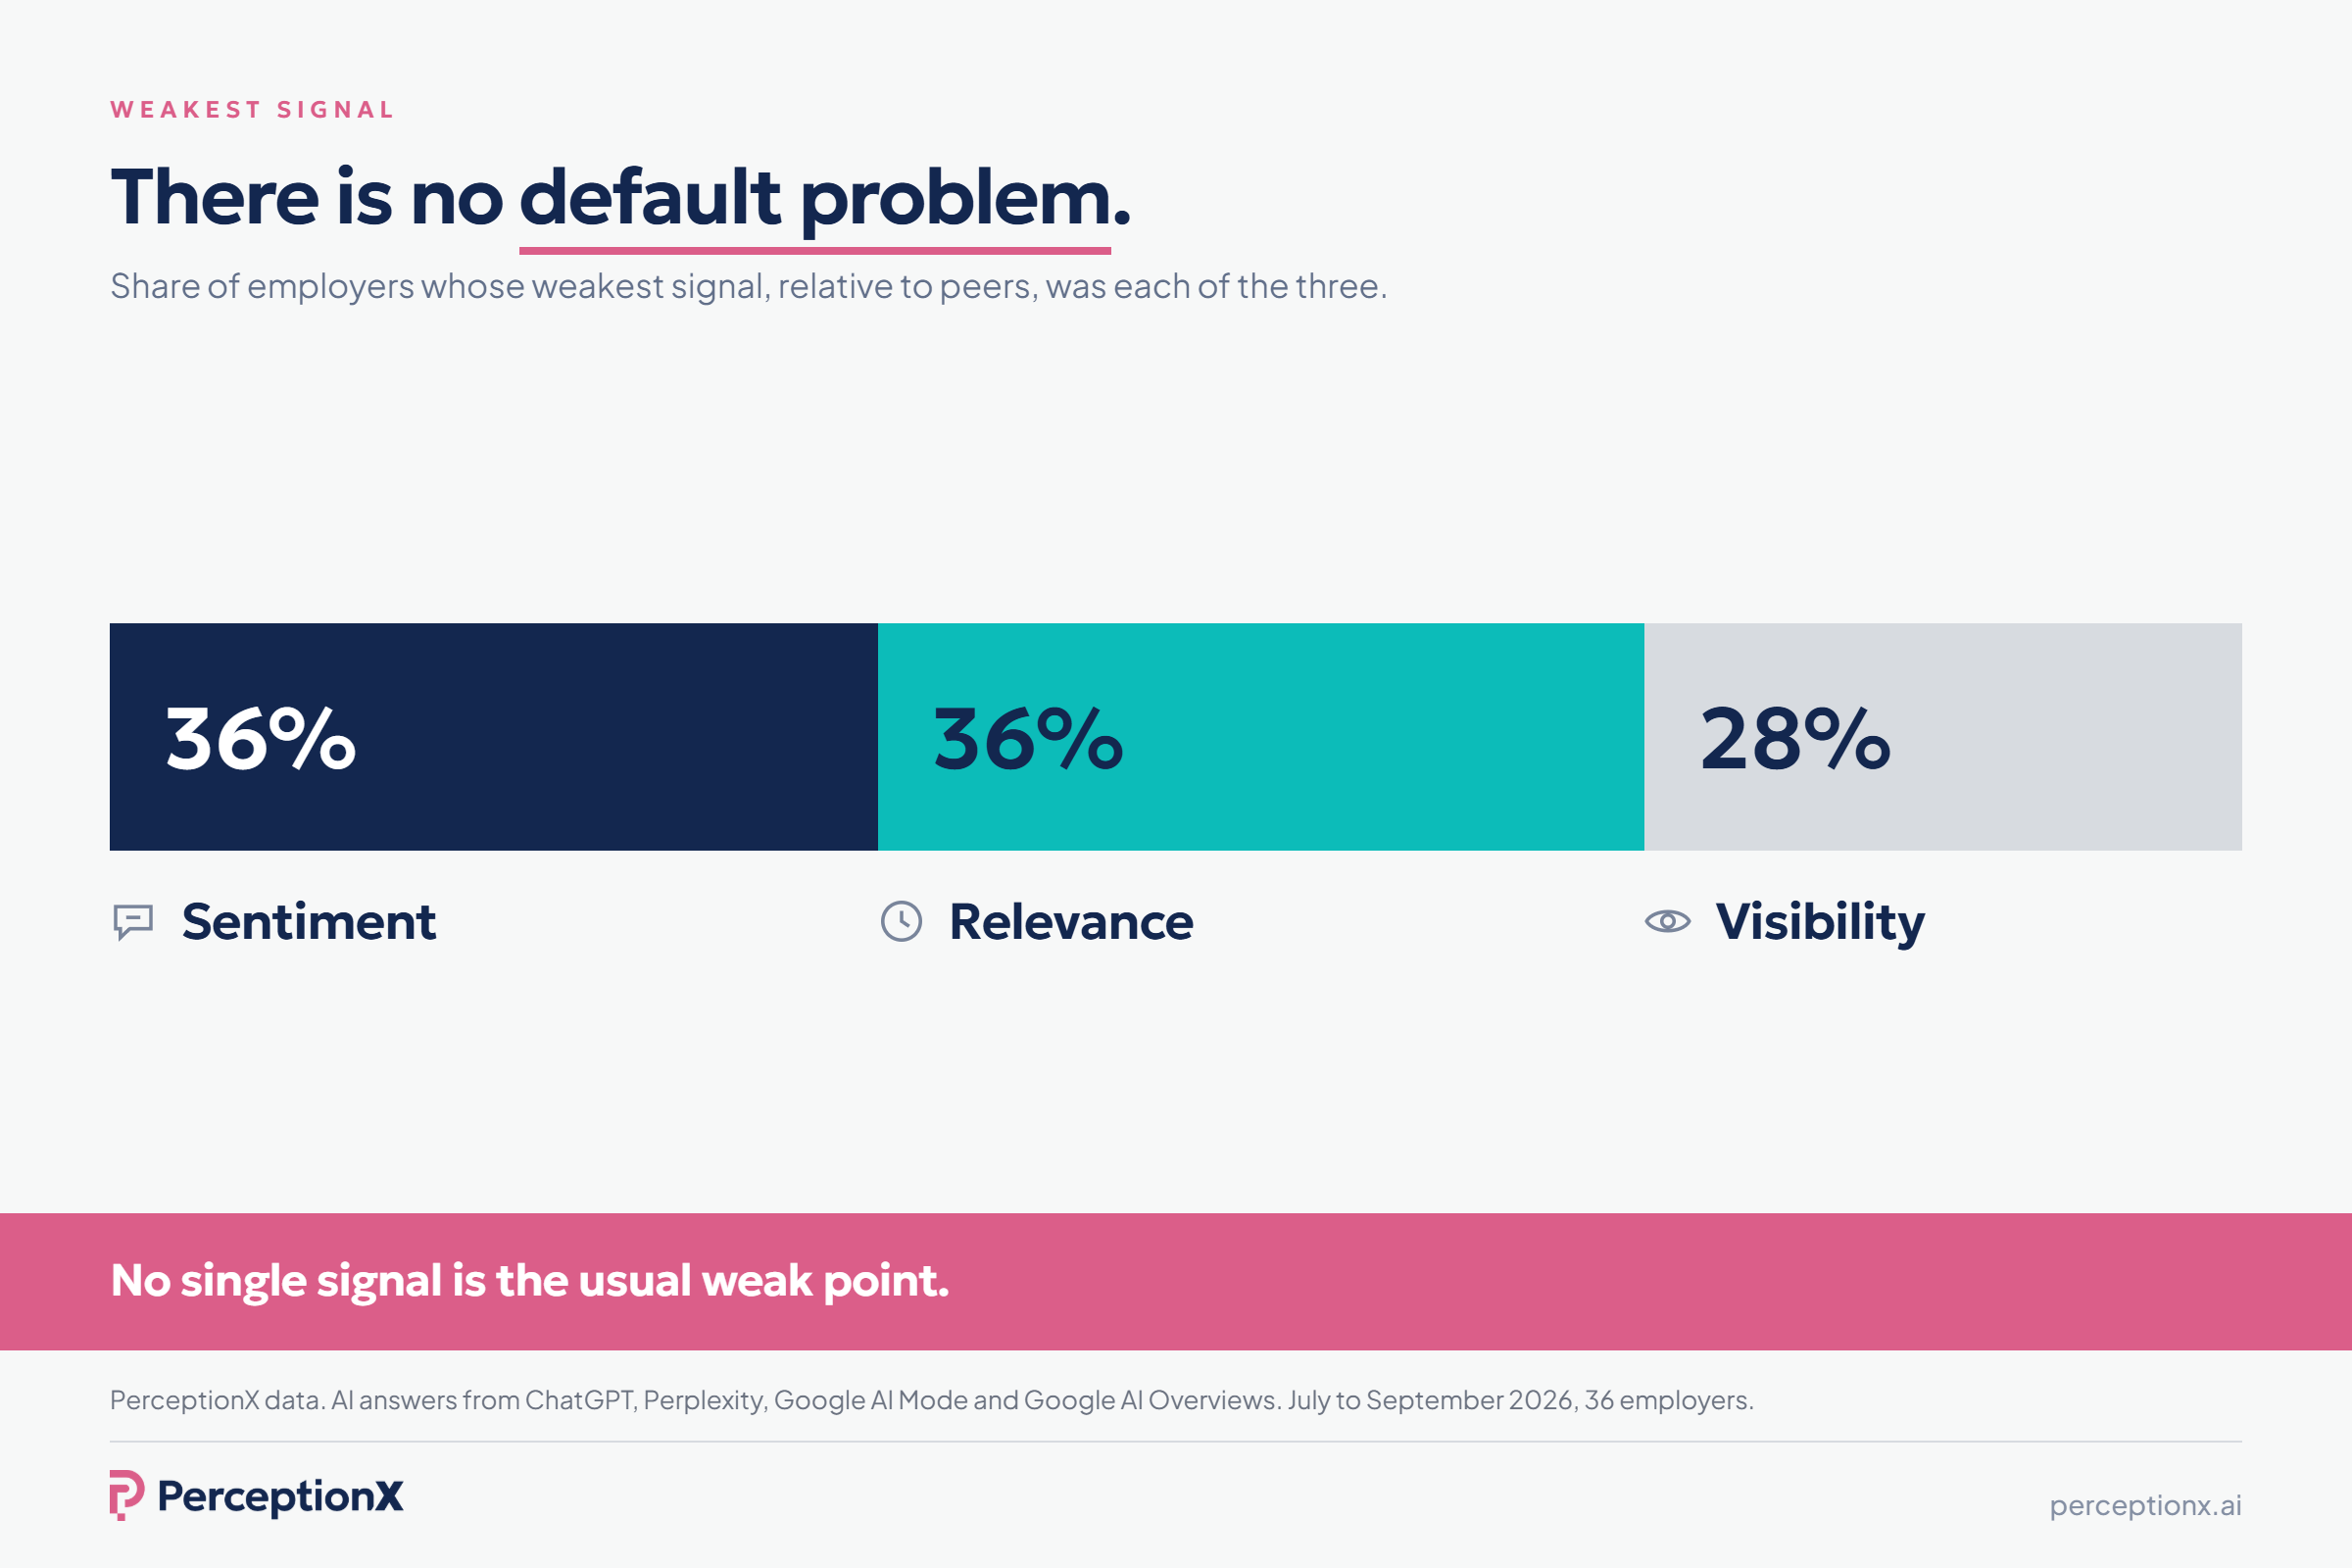
Three things stand out. Visibility is the signal with the widest spread and the lowest floor: 39% of tracked employers were mentioned in fewer than one discovery answer in ten, and 64% in fewer than one in four. Sentiment is tightly bunched, which means a few points of movement are meaningful, not noise. And no single signal is the usual weak point: for 36% of employers the weakest signal relative to peers was Sentiment, for 36% it was Relevance, for 28% it was Visibility. There is no default problem. There is only the one the cuts reveal.
The market cut is where the composite most reliably misleads. One consumer goods employer in the same period held 83% sentiment in Brazil, 71% in India and 58% in the United States. Its global figure would have landed in the low seventies and described none of its markets.
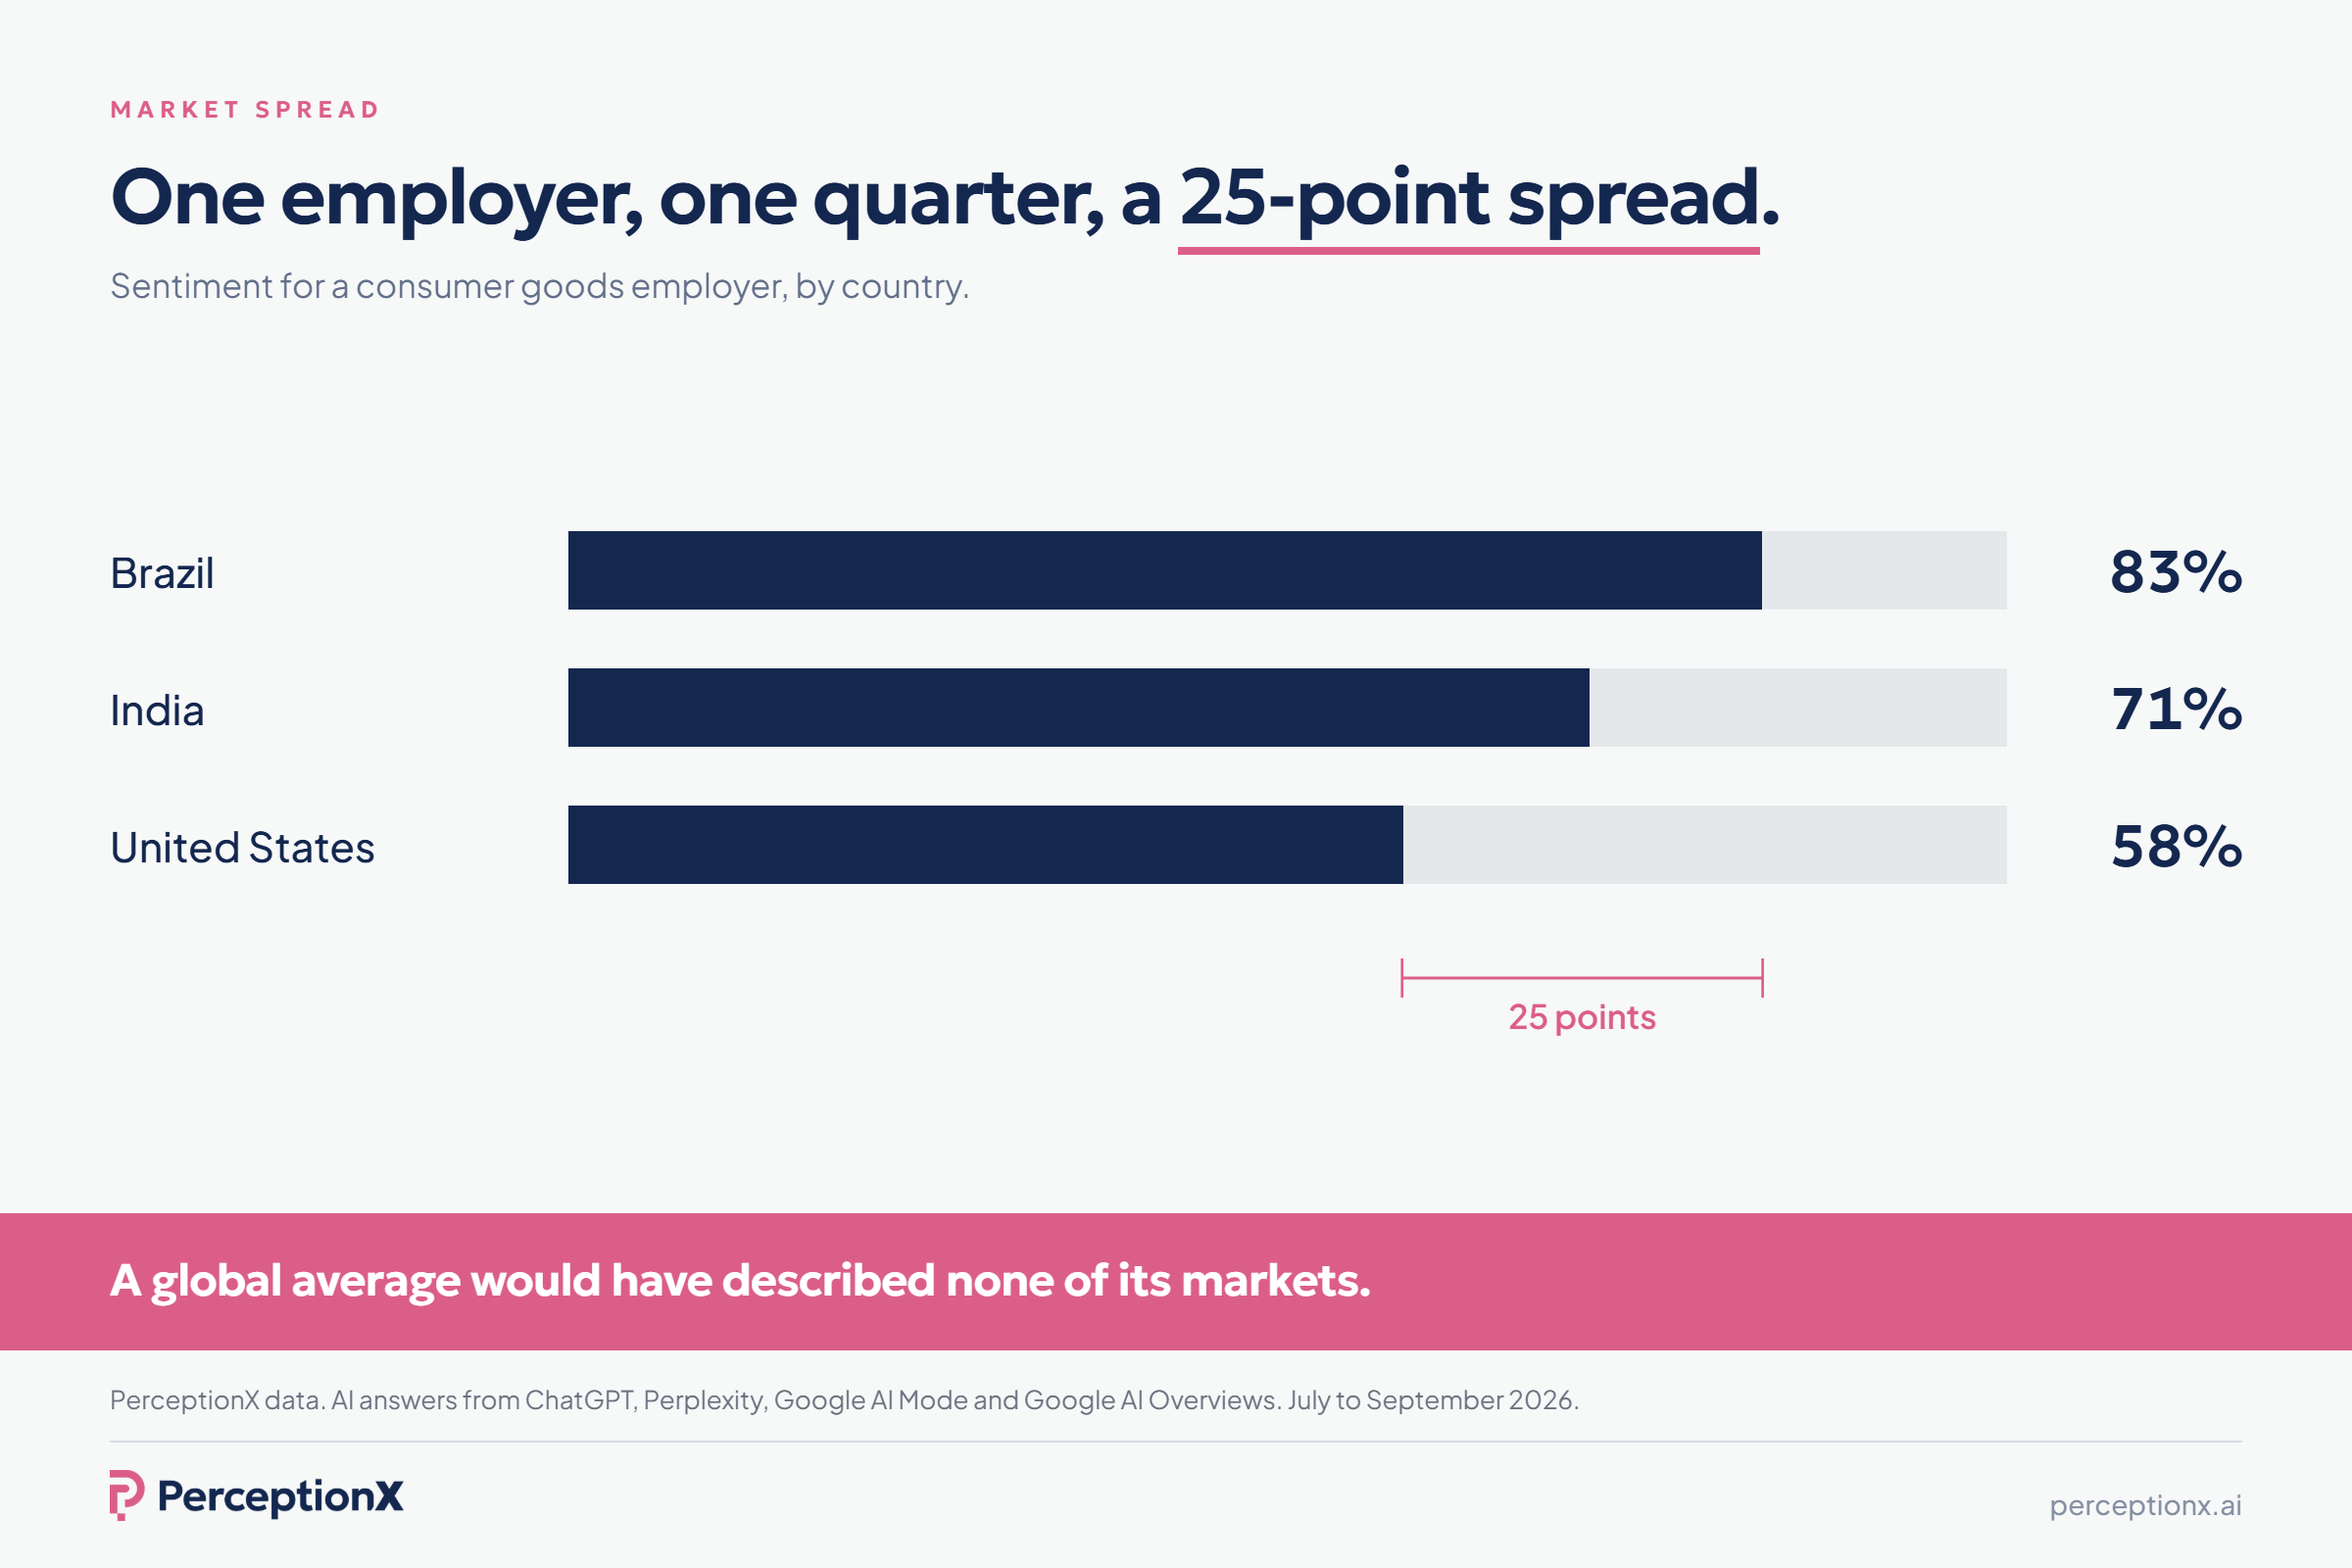
The pattern these figures show is that the composite hides the problem. An employer with a respectable global score can be invisible in a market it considers strategic, or strong on culture and weak on career opportunities for exactly the function it is trying to grow. The point of the cuts is to find that before the funnel does.
Making measurement repeatable
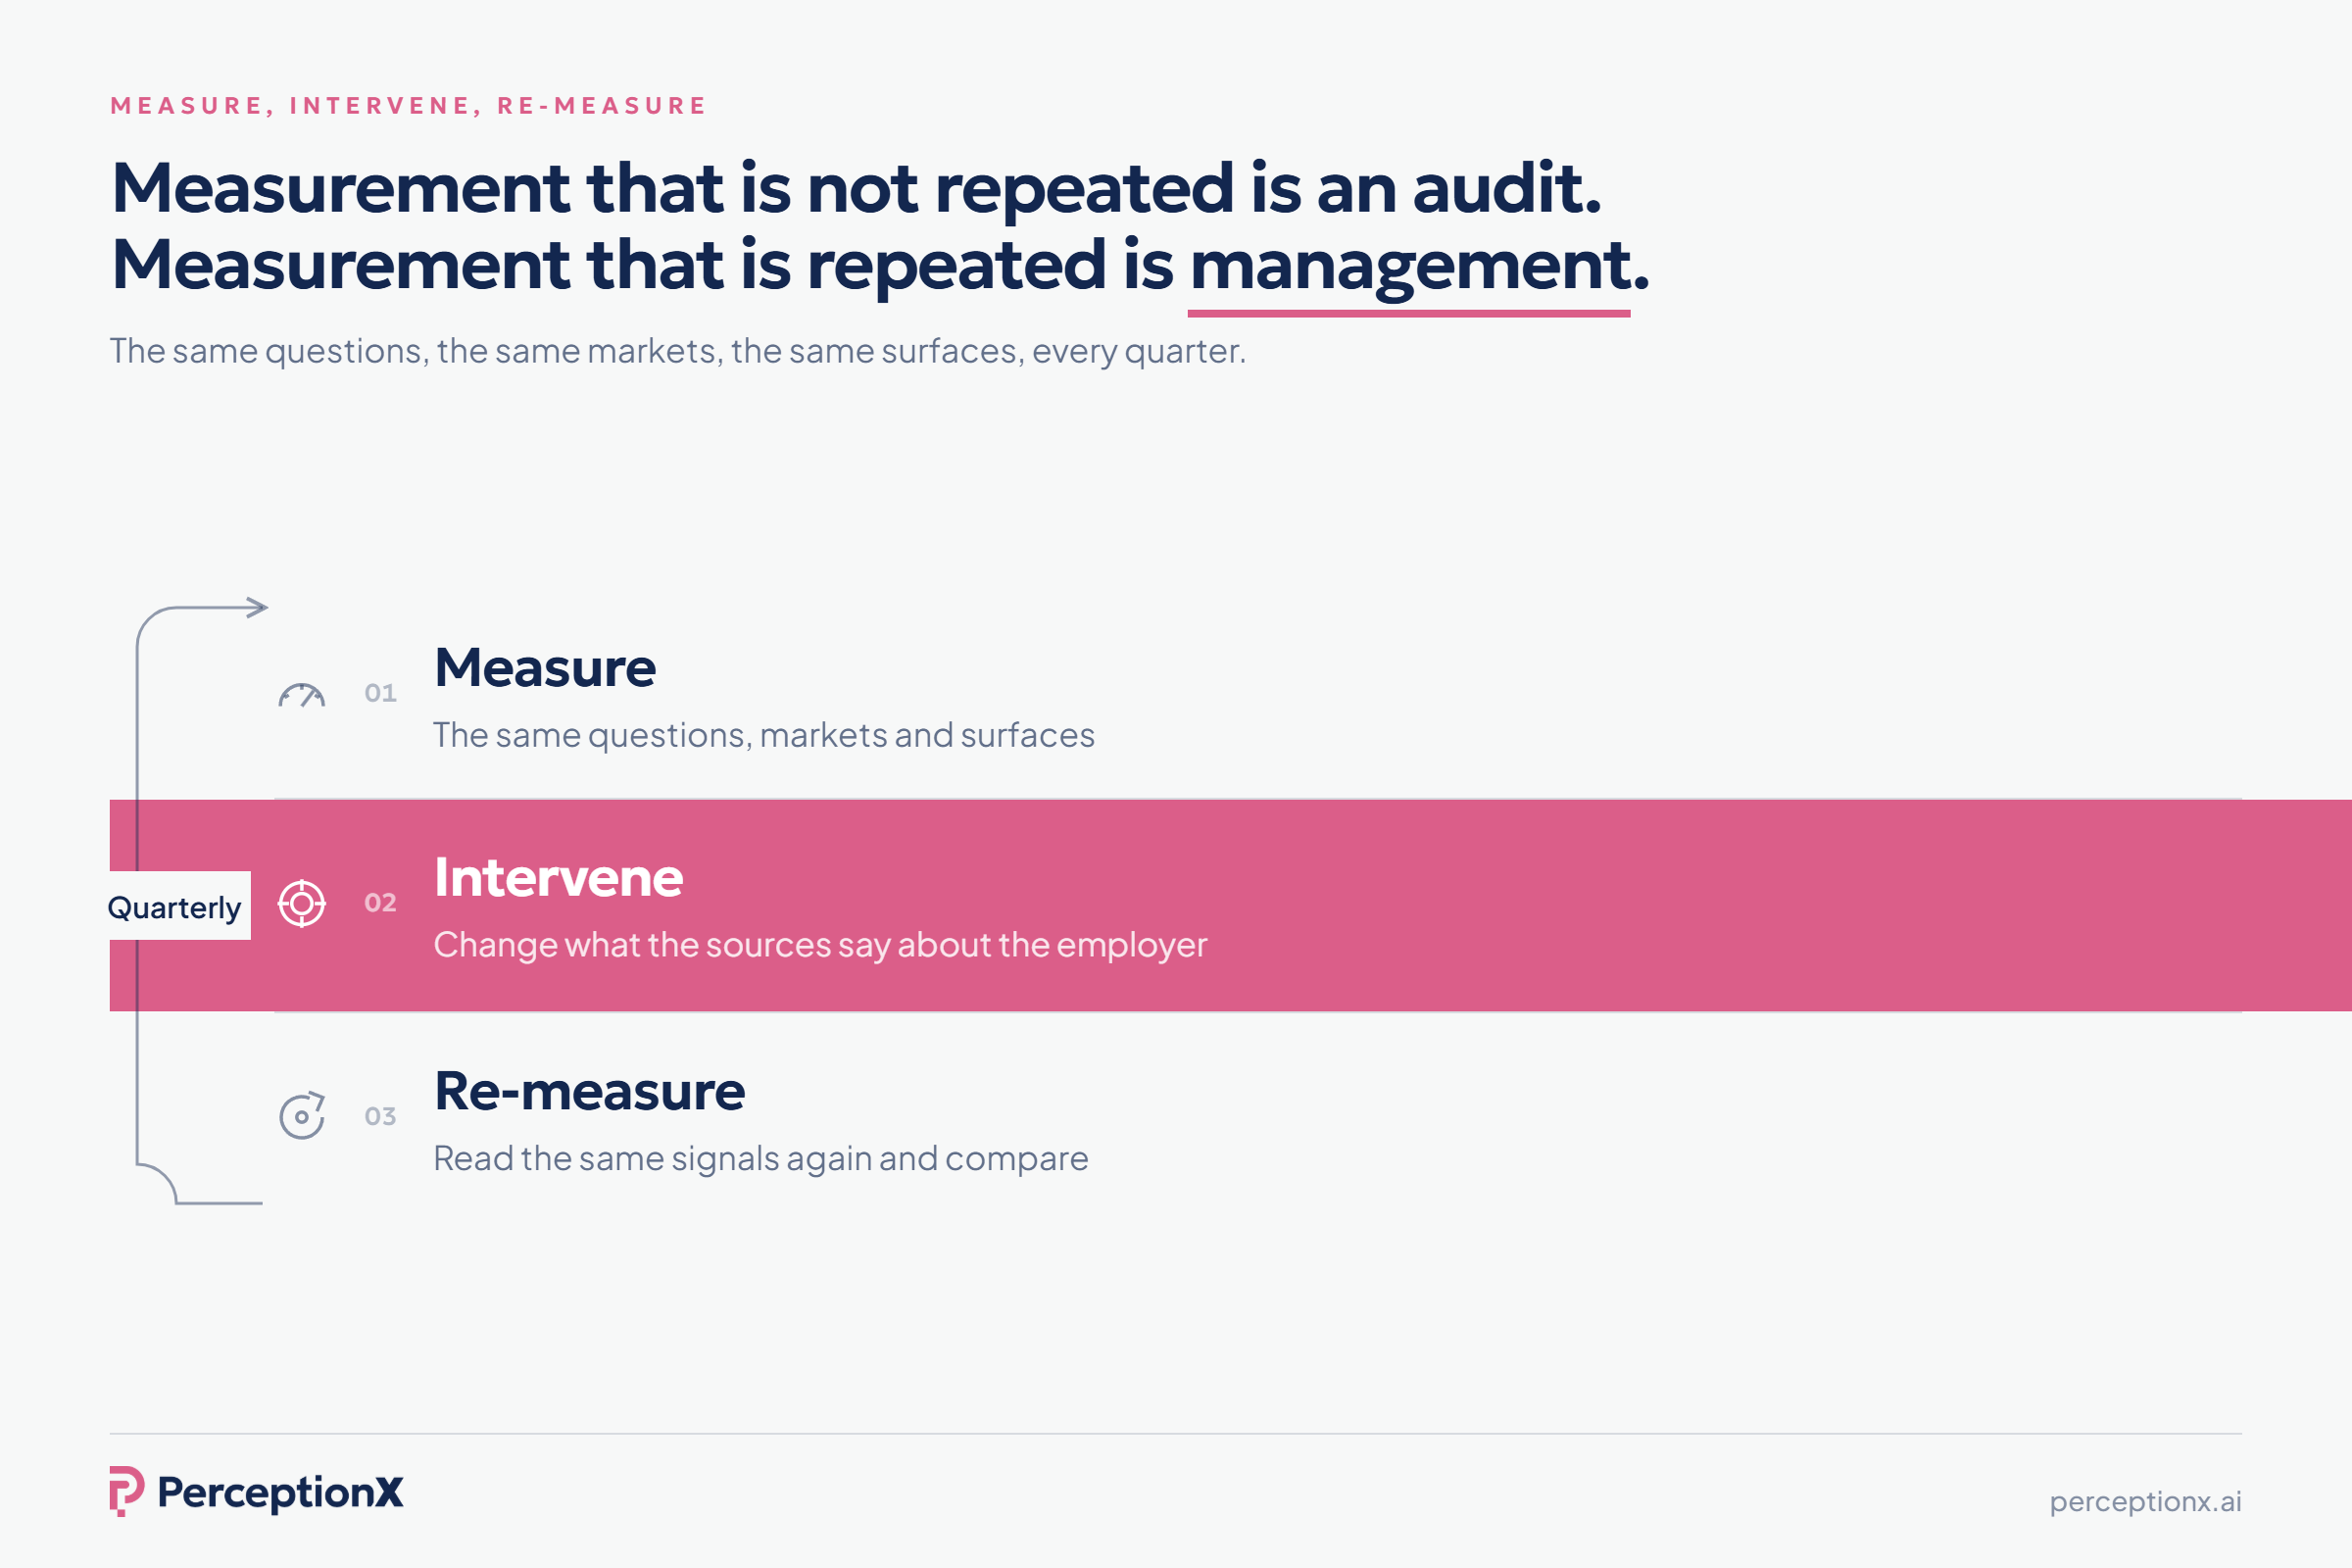
One reading is an audit. It tells you where you stand today. It cannot tell you whether anything you do afterwards worked.
Measurement that can show change needs four properties.
Consistent questions. The same prompts, in the same markets, on the same surfaces, each period. If the questions change, the movement is noise.
A fixed competitor set per market. Chosen once, changed only deliberately, so that the competitor gap is comparable over time.
A cadence that matches how reputation moves. Annual surveys were designed for a world where reputation moved annually. AI surfaces update continuously and press events move sentiment within a quarter. Quarterly is the minimum cadence at which change can be seen and attributed.
Interventions logged against the readings. If the team changed something in a market, the next reading in that market is the test. This is the loop: measure, intervene, re-measure. It is what turns employer reputation from a topic into a managed programme.
How this differs from what you may already have
If the team already tracks review-site ratings, keep them. They are one source, and the source cut will show how much they matter in each market.
If the team runs an annual brand perception survey, keep it. It measures a different population by a different method and gives a useful cross-check. What it cannot give is the market, function and surface granularity, or the cadence.
If the team reports funnel metrics, keep those too. Reputation measurement does not replace them. It explains them.
What changes is that reputation becomes a measured quantity with its own signals, its own cuts and its own trend, rather than an inference from everything else.
Where to go from here
The category itself, and why brand and reputation diverge, is set out in Employer Reputation for Global Employers.
The tools that support this kind of measurement, and how to evaluate them, are covered in Tools to Measure and Analyse Employer Reputation.
If the immediate need is a one-time reading rather than a programme, The Employer Brand Audit describes what to include.

Find out how AI is shaping your employer brand — and what you can do about it.