Employer Branding Analytics: What to Measure and How to Use It

Employer branding analytics is the practice of combining employer branding data from hiring systems, the career site, review sites, social media, surveys and AI answers, then analysing it to explain why candidates choose or reject you and what to change. Metrics tell you what happened. Analytics tells you why it happened, where, and what to do next.
Most TA teams already collect more numbers than they use. The applicant tracking system counts applications, the career site counts visits, review sites publish ratings and the engagement survey produces a score. The problem is rarely a shortage of data. It is that nobody joins the sources together, so each number is reported alone and nothing gets decided.
This guide is for heads of employer brand and talent acquisition at large employers. It covers the data sources, the questions analytics should answer, how to build an employer branding dashboard that leadership will read, who should own it and how often to run it. For definitions and formulas of the individual measures, see our guide to employer branding metrics. This post is about analysis and use.
What is employer branding analytics?
Employer branding analytics, also called employer brand analytics, is the analysis layer that sits on top of your measurement. It takes the key metrics you track and asks three things of them: what changed, why it changed, and what the business should do in response.
A useful way to separate the terms:
- Employer branding data is the raw material: applications, page views, reviews, survey answers, AI answers.
- Employer branding metrics are the numbers you calculate from that data, such as offer acceptance rate or cost per hire.
- Employer branding analytics is the work of segmenting, comparing and connecting those metrics so they explain hiring outcomes.
- An employer branding dashboard is how the analysis reaches the people who make decisions.
Employer branding measurement and analytics belong together. Measurement without analysis produces a report nobody acts on. Analysis without sound measurement produces confident conclusions from bad numbers.
Why measuring employer branding needs analysis, not just reporting
Measuring employer branding is hard because the thing you are measuring, perception, sits outside your systems. Candidates research an employer long before they appear in your data. They read company reviews and ratings, ask friends, scroll social media and, increasingly, ask an AI assistant. By the time someone applies, most of the decision has been made somewhere you cannot see.
That is why a single number rarely helps. A falling application count could mean a weaker employer brand, a tighter labour market, a broken apply flow or a change in job descriptions. Only analysis tells you which. Our guide on how to measure employer brand sets out the measurement steps. Analytics is what turns those steps into decisions.
Good analysis gives employer brand leaders three things:
- Diagnosis. Where the candidate journey breaks, and for whom.
- Priority. Which problem is worth fixing first, given the roles the business strategy depends on.
- Proof. Evidence that employer branding efforts changed something, which is the basis of any business case for continued investment.
Employer branding data sources: where the evidence comes from
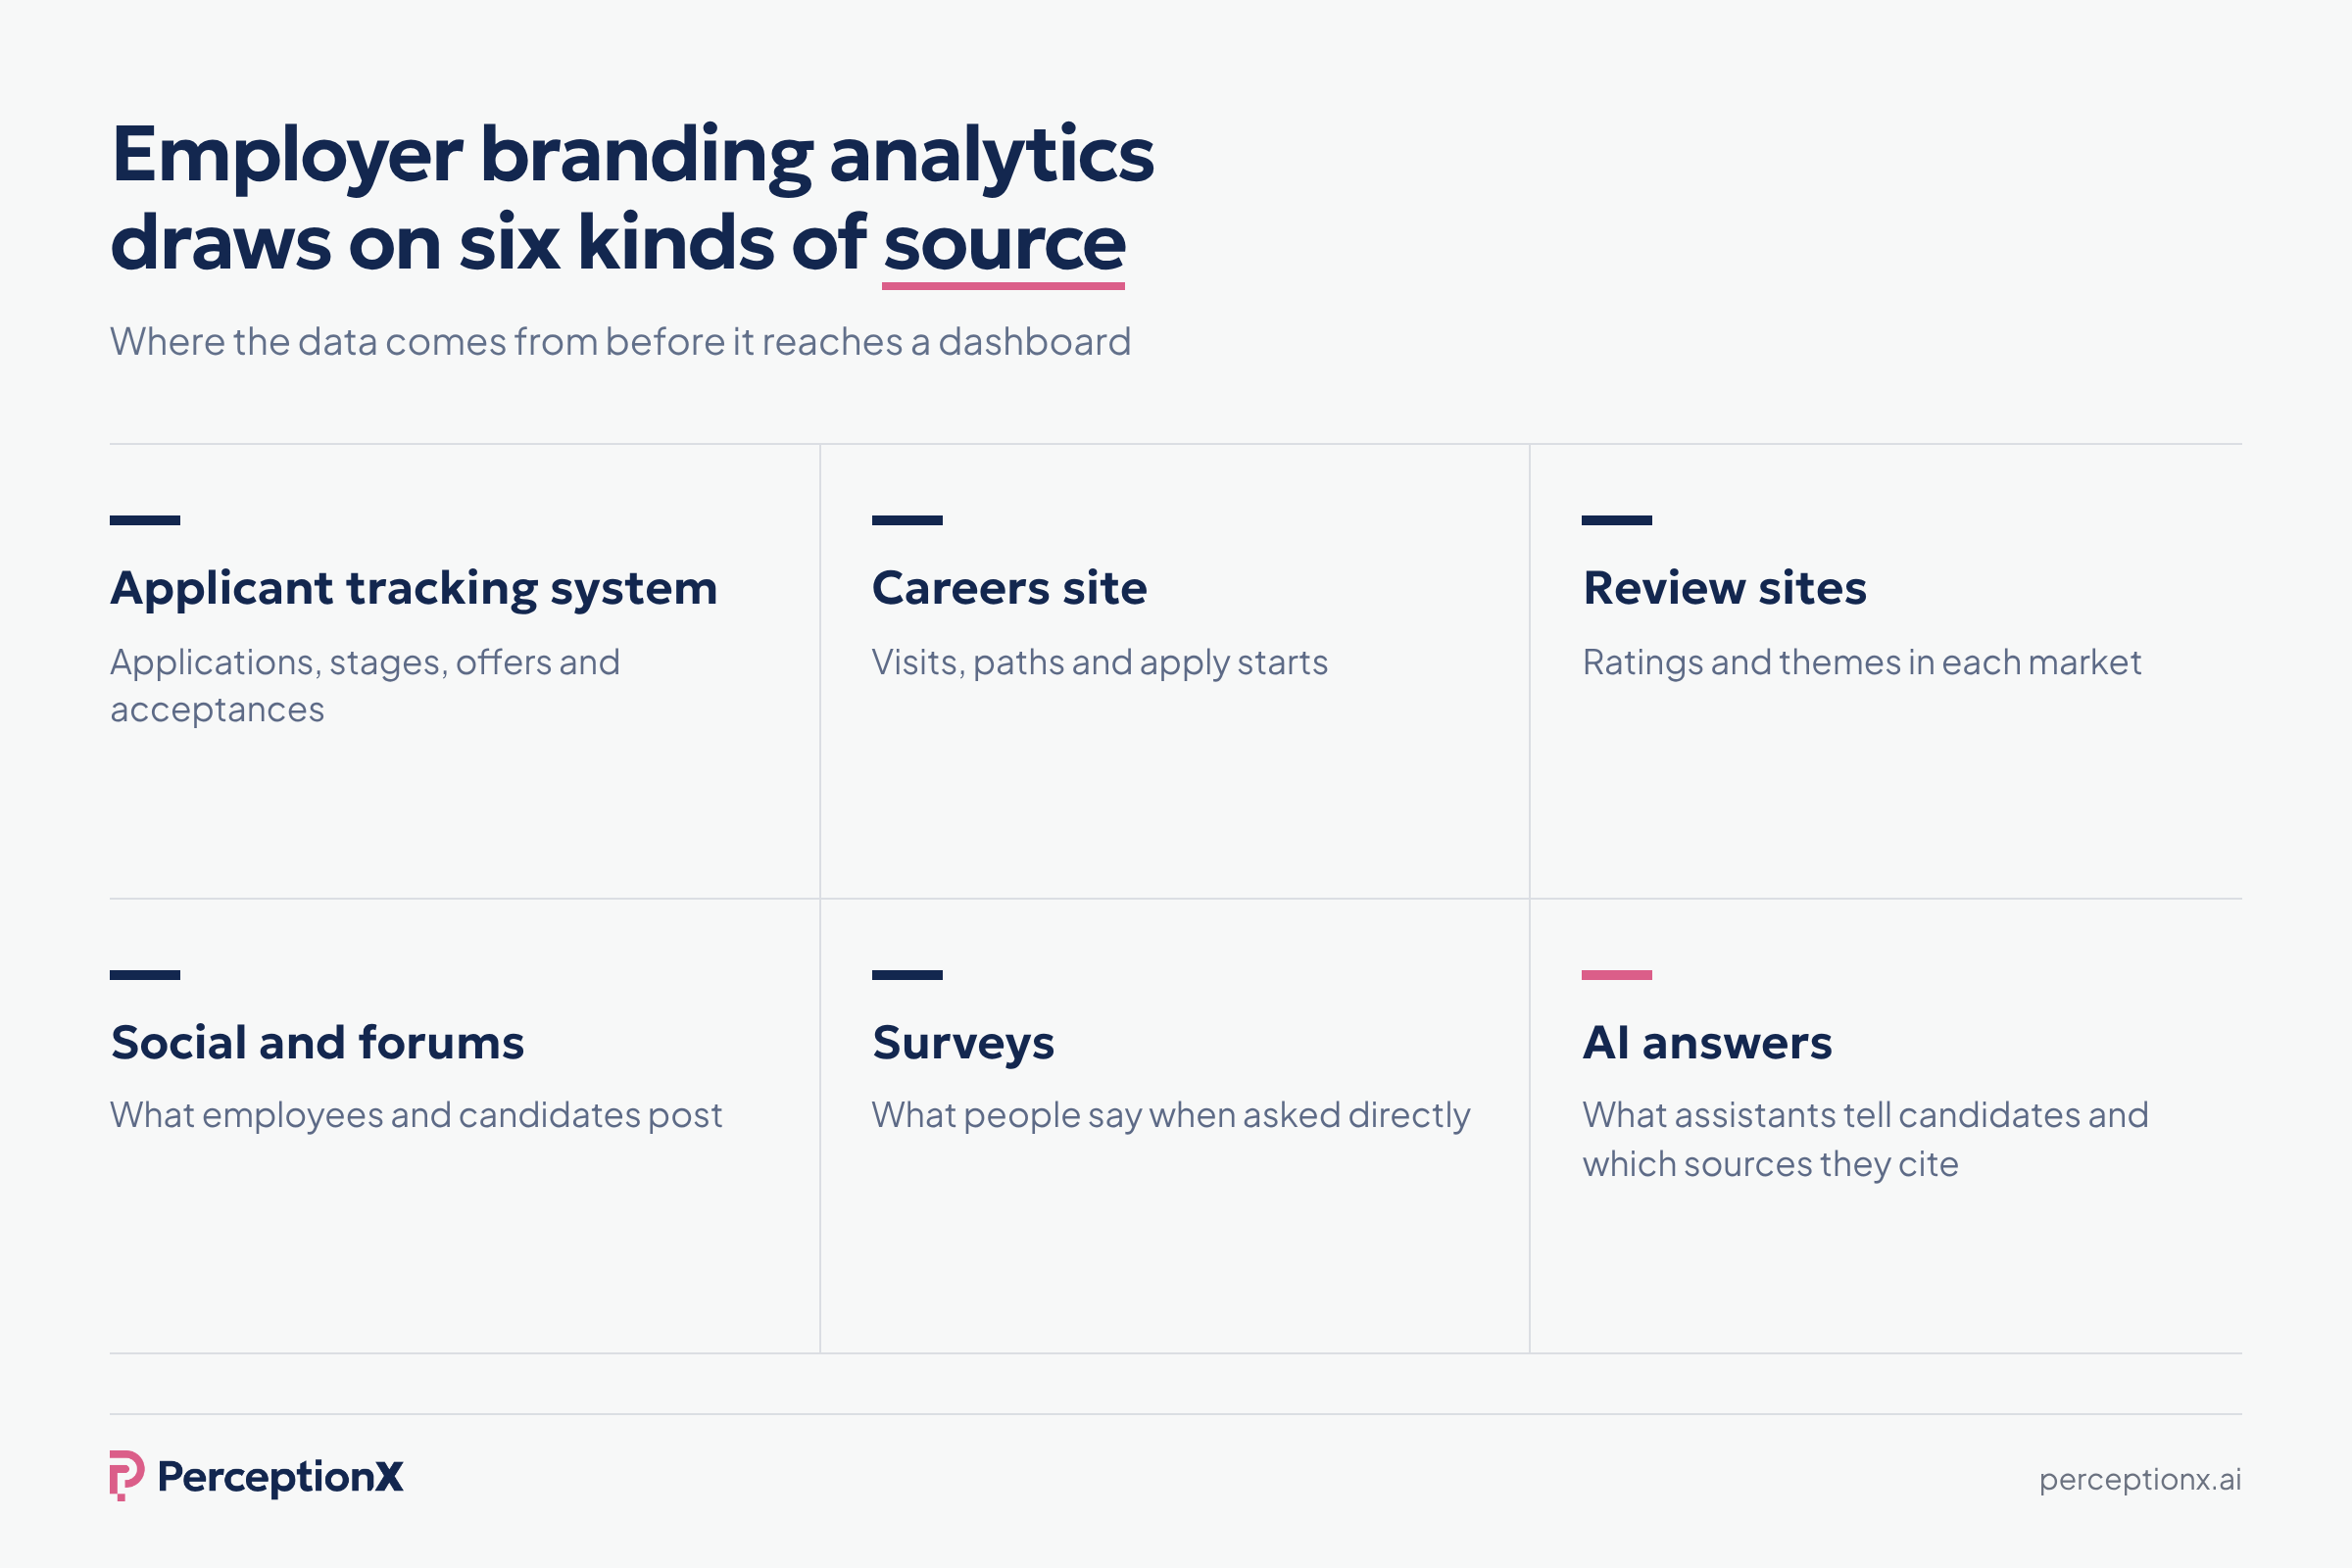
Six sources cover most of what talent leaders need. Each answers a different question, and each misleads in its own way. The skill is in reading them together.
Applicant tracking system and hiring data
Your ATS holds the outcome data: applications, qualified applicants, stage conversion, time to hire, time to fill, offer acceptance and source of hire. Add finance data and you get cost per hire. Add HR data and you get new hires who stay, which is the closest thing to a measure of candidate quality. Employee referral rate belongs here too, as a sign of whether your own people would recommend you.
This is where business outcomes live, so it anchors everything else. Its limit is that it records candidate behaviour only after someone applies. It cannot see the qualified candidates who looked at you and walked away.
Career site and careers page analytics
Web analytics on your career site show what potential candidates do before they apply: which pages they land on, how far they read, which job descriptions they open and where they abandon the application. Search data shows how many people look for your company name alongside words like jobs or careers, and which questions bring them to your careers page.
Treat the career site as a funnel. The useful measures are the ratios between steps, not the totals. As AI assistants read career sites too, the content also shapes what candidates are told elsewhere.
Review sites
Glassdoor, Indeed and local platforms hold what real employees say in public. Candidates who research company reviews are looking for patterns: pay, managers, workload, work life balance, career development and whether the company culture matches the careers page.
Analyse themes and trends, not the star rating alone. A stable rating can hide a growing complaint in one function. Note whether the employer actively manages its profile and responds to reviews, because candidates read the responses too.
Social media and employee advocacy
Social media data covers your own channels, employee advocacy and what others say about you on LinkedIn, Reddit and elsewhere. Reach, followers and likes are the classic vanity metrics. They become useful only when you connect them to something further down the funnel, such as career site visits from a post or applications from people who engaged with employee content. Employee voice matters most here. Employee shared content is more credible than brand messaging, because candidates trust employees more than company communications, and strong employer brands use employee advocacy for that credibility.
Look at which formats and voices travel. If video storytelling from engineers outperforms corporate posts with the audience you need, that is a finding. If recruiter outreach gets better reply rates in markets where employee advocacy is active, that is a stronger one.
Surveys: candidate experience and employee engagement
Surveys are the only source that asks people directly. Candidate experience surveys tell you how the hiring process felt, including for people you rejected. New hire surveys tell you what almost stopped them accepting. Employee engagement surveys and exit interviews tell you how current employees feel and whether the promise held up.
Read open text answers, not just scores. Our guide to candidate experience metrics covers what to ask and when.
AI answers
AI assistants such as ChatGPT, Gemini and Perplexity now sit between your employer brand and many job seekers. They read review sites, forums, news and your own pages, then give a candidate a single summarised answer. That answer is data you can collect and analyse: whether you are named, how you are described, whether it is accurate and which sources it came from. A full section below explains how.
| Data source | What it tells you | Where it misleads |
|---|---|---|
| ATS and hiring data | Who applied, who progressed, who accepted, and how long each stage took | Shows what happened, not why, and misses everyone who decided not to apply |
| Career site analytics | What interested job seekers read, where they came from and where they dropped out | Traffic is easy to inflate and says little about candidate quality |
| Review sites | What current and former employees say about pay, managers, culture and career development | Small review volumes swing ratings, and one location can distort the whole picture |
| Social media | Which stories and voices reach potential candidates, and what people say back | Reach and likes are vanity metrics unless they connect to applications |
| Surveys | What candidates and employees feel, in their own words | Slow, sample dependent and shaped by how the questions are asked |
| AI answers | What AI assistants tell candidates about you, and which sources those answers rely on | Answers vary by assistant, market, role and language, so one check proves nothing |
The questions employer brand analytics should answer
Start with the business problem, not the dashboard. Hiring teams and executives do not ask for metrics. They ask questions. An analytics practice is working when it can answer these seven.
- Do the people we need know us as an employer? Compare awareness and consideration among your priority talent groups, not the general public.
- What do they hear about us, and is it true? Combine review themes, survey findings and AI answers to see the picture a candidate actually gets.
- Where do we lose them? Follow the candidate journey from first visit to accepted offer and find the step with the steepest drop for each priority role.
- Which roles and markets are different? A company average hides everything. Split every measure by market, job function and seniority.
- Which activity changed anything? Compare before and after, or compare a market that ran a campaign with one that did not.
- How do we compare with the employers we lose candidates to? Benchmark against named talent competitors, not leading companies in general.
- What is it worth? Translate the change into hiring outcomes and money so the business impact is clear.
If a metric on your dashboard does not help answer one of these, remove it.
A worked method: from a number to a decision
The same five steps work for almost any employer brand question.
- State the question in business terms. Not "how is our employer brand" but "why do fewer engineers accept our offers in one market".
- Segment. Cut the outcome metric by market, role and source until the problem is located.
- Explain. Bring in the perception sources for that segment: reviews, surveys and AI answers.
- Decide. Choose one action with an owner and a date.
- Measure again. Check both the leading indicators and the outcome.
For example, imagine a company whose overall offer acceptance rate looks healthy at 80%. This is an illustration, not research. Segmenting shows that acceptance rate for engineering roles in one market is 60%, while every other segment sits close to the average. The gap is 20 points, and it is concentrated in one place.
The team then reads the perception data for that segment. Review themes for the local engineering site mention slow promotion. Candidate surveys show declined offers citing career development. AI answers about working there as an engineer repeat the same theme and cite an old forum thread. Three independent sources point to one cause.
The decision follows: publish current promotion data and career paths on the careers page, brief hiring managers to address progression in interviews, and encourage engineers on site to share their experience. The leading indicators to watch are review themes and AI answers. The outcome to watch is acceptance rate in that segment.
A simple way to express the value is:
Value of the change = additional accepted offers x cost of restarting a search.
For example, if closing the gap would avoid ten restarted searches a year and each costs the business a figure finance agrees, the value is ten times that figure. Use your own finance numbers, state the assumptions and show the calculation. Leadership trusts a modest, transparent estimate more than a large unexplained one.
What AI tells candidates is now part of employer reputation measurement
Traditional employer branding analytics stops at the sources a human reads. That is no longer the whole candidate journey. In PerceptionX research, 72% of AI-using job seekers used AI before deciding whether to apply, and 82% said an AI answer changed their mind about a company as a place to work. The same research found that 58% had caught AI giving inaccurate information about an employer.
So a candidate can form a view of you, and act on it, without visiting a single page you control. If your analytics does not include what AI says, it is missing the step where many decisions are now made. This is why employer reputation, meaning what others say about you, matters as much as the employer brand you project.
Including AI answers in your analysis means collecting four things consistently:
- Whether you are named when candidates ask which employers to consider for a role.
- How you are described, by theme: pay, culture, flexibility, progression, leadership.
- Whether it is accurate, checked against your real policies and offer.
- Which sources the answer relies on, because that tells you what to fix.
The method matters. Ask the questions candidates actually ask, repeat them across assistants, and split the results by market, job function and language, because the answer for a nurse in one country is not the answer for an engineer in another. A handful of manual checks is an anecdote, not analytics.
PerceptionX is built for this. It measures what AI tells candidates across ChatGPT, Google AI Overviews, Google AI Mode and Perplexity, by market, job function and language, and brings it together in the Employer Perception Score. It also traces answers to their sources, so you can see which review site, forum or page is shaping what candidates hear.
Measurement is only the start: every finding comes with recommendations on what to change, and practitioners who have measured employer brand for years help your team act on them.
Our scores are independent: they come from what AI actually says, not from what employers tell us.
In practice, AI answers work as one of your best leading indicators. They summarise the sources candidates would otherwise read one by one, so a shift in how AI tools describe you often appears before it shows in applications or acceptance.
How to build an employer branding dashboard leadership will read
Most employer branding dashboards fail for the same reason: they show everything. Executives and HR professionals outside the team will give it a minute. Design for that minute.
- One page. If it needs scrolling, it needs editing.
- One headline. A single measure of employer brand health with its trend, and a sentence saying why it moved.
- Outcomes beside perception. Pair every perception measure with the hiring outcome it should influence, so the employer brand impact is visible.
- Segments that match the business. Show the markets and job functions leadership already talks about.
- Comparison. Every number needs a reference point: last quarter, target or talent competitors.
- Actions. End with what you are doing, who owns it and what should change.
Internal and external metrics should sit side by side. Internal numbers show what happened in your process. External metrics, such as review themes and AI answers, show what candidates saw before they entered it. A dashboard with only one of the two tells half the story.
| Dashboard section | Question it answers | Evidence to show | Owner |
|---|---|---|---|
| Headline | Is our employer brand health improving, flat or declining? | One composite score with its trend and a single sentence explaining the movement | Head of employer brand |
| Perception | What do candidates hear about us before they apply? | AI answers, review themes and survey results, split by market and job function | Employer brand |
| Attraction | Are the right people applying? | Qualified applicants per opening and apply rate from career site visits, by priority role | Talent acquisition |
| Conversion | Do candidates say yes? | Offer acceptance rate and the reasons given for declined offers | Talent acquisition and hiring managers |
| Experience | Does the reality match the promise? | Candidate experience scores, new hire retention and employee engagement themes | People analytics |
| Actions | What are we doing about it? | Three actions with an owner, a date and the number each one should move | Head of employer brand |
Write the commentary before you design the charts. If you cannot state the finding in two sentences, the chart will not rescue it.
Cadence and ownership
Analytics needs a rhythm, or it becomes a project that happens once.
- Weekly: social media and forum mentions, watched for sudden changes only.
- Monthly: career site funnel, applications, qualified applicants, review themes and AI answers for priority roles.
- Quarterly: the full dashboard for leadership, with segment analysis, talent competitor comparison and a review of actions.
- Annually: a deeper review that resets targets and feeds the employer brand strategy for the year ahead.
Ownership should be explicit. The head of employer brand owns the analysis and the story. The recruiting team owns ATS data quality, because analysis is only as good as the stage and source fields recruiters complete. People analytics owns survey data and the joins between systems. Hiring managers own the actions that sit in their teams. One person, named, signs off the numbers before they go to leadership.
Many teams find the first full cycle is mostly data cleaning. That is normal. An employer brand audit is a sensible starting point because it sets the baseline every later comparison depends on.
Connecting analytics to employer brand strategy and the business case
Analytics earns its place when it changes what you do. Use it to decide where the employer brand resonates and where it does not, which messages attract talent you want, and which promises the employee experience cannot yet support. That is how an employer brand strategy stays tied to evidence.
It also protects the budget. A strong employer brand shows up as more qualified candidates applying, better fit candidates reaching interview, higher acceptance and lower reliance on paid sourcing. When you can show that link for the roles the business cares about, the case for a strong employer proposition is no longer a matter of opinion. It reflects the company's ability to hire the top talent its plans require.
The financial logic is simple. A strong employer brand lowers cost per hire and reduces turnover, while a weak employer brand can increase hiring costs significantly, because you pay more in advertising, agency fees and salary premiums to persuade people to join. That is why executive teams increasingly treat employer branding as a priority. To express it as a return, use the standard formula:
Employer branding ROI = (value generated minus costs) / costs.
Value generated is the saving or gain you can evidence, such as lower cost per hire, faster time to fill or fewer early leavers. Costs are what the employer branding work took to deliver.
Check brand consistency too. Compare the brand language on your careers page and job descriptions with the words candidates and employees use in surveys and reviews. Where the two differ, either the message or the experience needs to change.
Common pitfalls in employer branding measurement and analytics
- Reporting vanity metrics. Followers, impressions and page views feel like progress and prove little. Tie each one to a later step or drop it.
- Using company averages. Employer brands are local and role specific. An average across markets and functions hides the problem and the win.
- Confusing correlation with cause. Applications rose after a campaign and after a competitor froze hiring. Use comparison groups before claiming credit.
- Ignoring data quality. Missing source fields and inconsistent stage names in the ATS quietly break every analysis built on them.
- Measuring only what you control. Your own channels are the easy part. What review sites, forums and AI assistants say is where candidates form their view.
- Checking AI once. A single prompt in a single assistant is not a measurement. Answers differ by assistant, market, role and language.
- Building the dashboard first. Tools do not create insight. Agree the questions, then choose what to show.
- Stopping at the report. Analysis that ends without an owner and a date changes nothing.
Key takeaways
- Employer branding analytics explains why your employer brand numbers move and what to do about it.
- Six data sources matter: ATS and hiring data, the career site, review sites, social media, surveys and AI answers.
- Start from business questions, segment by market and job function, and connect perception to hiring outcomes.
- What AI tells candidates is now part of the measurement and works as an early signal.
- A dashboard leadership will read fits on one page and ends with actions, owners and dates.
Frequently asked questions
What is employer branding analytics?
Employer branding analytics is the practice of combining employer branding data from hiring systems, the career site, review sites, social media, surveys and AI answers, and analysing it to explain why candidates choose or reject an employer and what to change.
What is the difference between employer branding metrics and employer branding analytics?
Metrics are the individual numbers, such as offer acceptance rate or cost per hire. Analytics is the work of segmenting, comparing and connecting those numbers so they explain hiring outcomes and lead to a decision.
How to measure employer branding?
Set a baseline for perception, attraction, conversion and experience, split it by market and job function, compare it with talent competitors and repeat it on a fixed cadence. Then analyse the changes against the activity you ran.
What data sources does employer brand analytics use?
The main sources are ATS and hiring data, career site analytics, employee review sites, social media, candidate and employee surveys, and the answers AI assistants give candidates about the employer.
What should an employer branding dashboard include?
One headline measure of employer brand health, perception measures paired with hiring outcomes, splits by market and job function, a comparison point for every number and a short list of actions with owners and dates.
How often should employer branding analytics be reviewed?
Watch social media weekly for sudden changes, review funnel, review and AI answer data monthly, present the full dashboard to leadership quarterly and reset targets annually.
Why include AI answers in employer branding analytics?
Because many candidates now ask AI assistants about employers before applying. In PerceptionX research, 72% of AI-using job seekers used AI before deciding whether to apply, and 82% said an AI answer changed their mind about a company as a place to work.

Find out how AI is shaping your employer brand — and what you can do about it.