Employer Branding ROI: How to Calculate and Prove It

Employer branding ROI is the financial return on what you spend building your reputation as an employer: the value of better hiring and retention outcomes, minus the cost of the work, divided by that cost. To measure employer branding ROI credibly, you need a baseline, a short list of outcomes that finance already prices, and an honest view of how much of the change your work caused.
Most teams can describe what they produced last year. Far fewer organisations measure the outcomes of their employer branding efforts, and fewer still can communicate the ROI of employer branding to leadership in terms the business accepts. This guide is for heads of employer brand and talent acquisition at large employers who need a number that survives a finance review: what the ROI of employer branding means, the formula, the inputs, a worked example, how to build the business case, and where AI answers now fit.
What is employer branding ROI?
Return on investment compares what an activity returned with what it cost. For employer branding, the return is rarely revenue. It is money the business did not have to spend, or value it did not lose: lower recruiting costs, roles filled sooner, fewer declined offers and fewer new hires leaving early.
That makes employer brand ROI a cost and risk argument more than a growth argument. A strong employer brand means more of the right people apply without being paid for, including passive candidates who would not otherwise have looked, more of them accept, and more of them stay. Companies with a strong employer brand depend less on expensive recruitment advertising for the same reason. Each of those business outcomes has a price that finance teams already recognise.
It also explains why vanity metrics fail. Followers, impressions and job clicks describe activity. They are useful awareness metrics for the employer brand team, but none of them is a return. The real ROI sits further down the recruitment funnel, where the work turns into hires and retention.
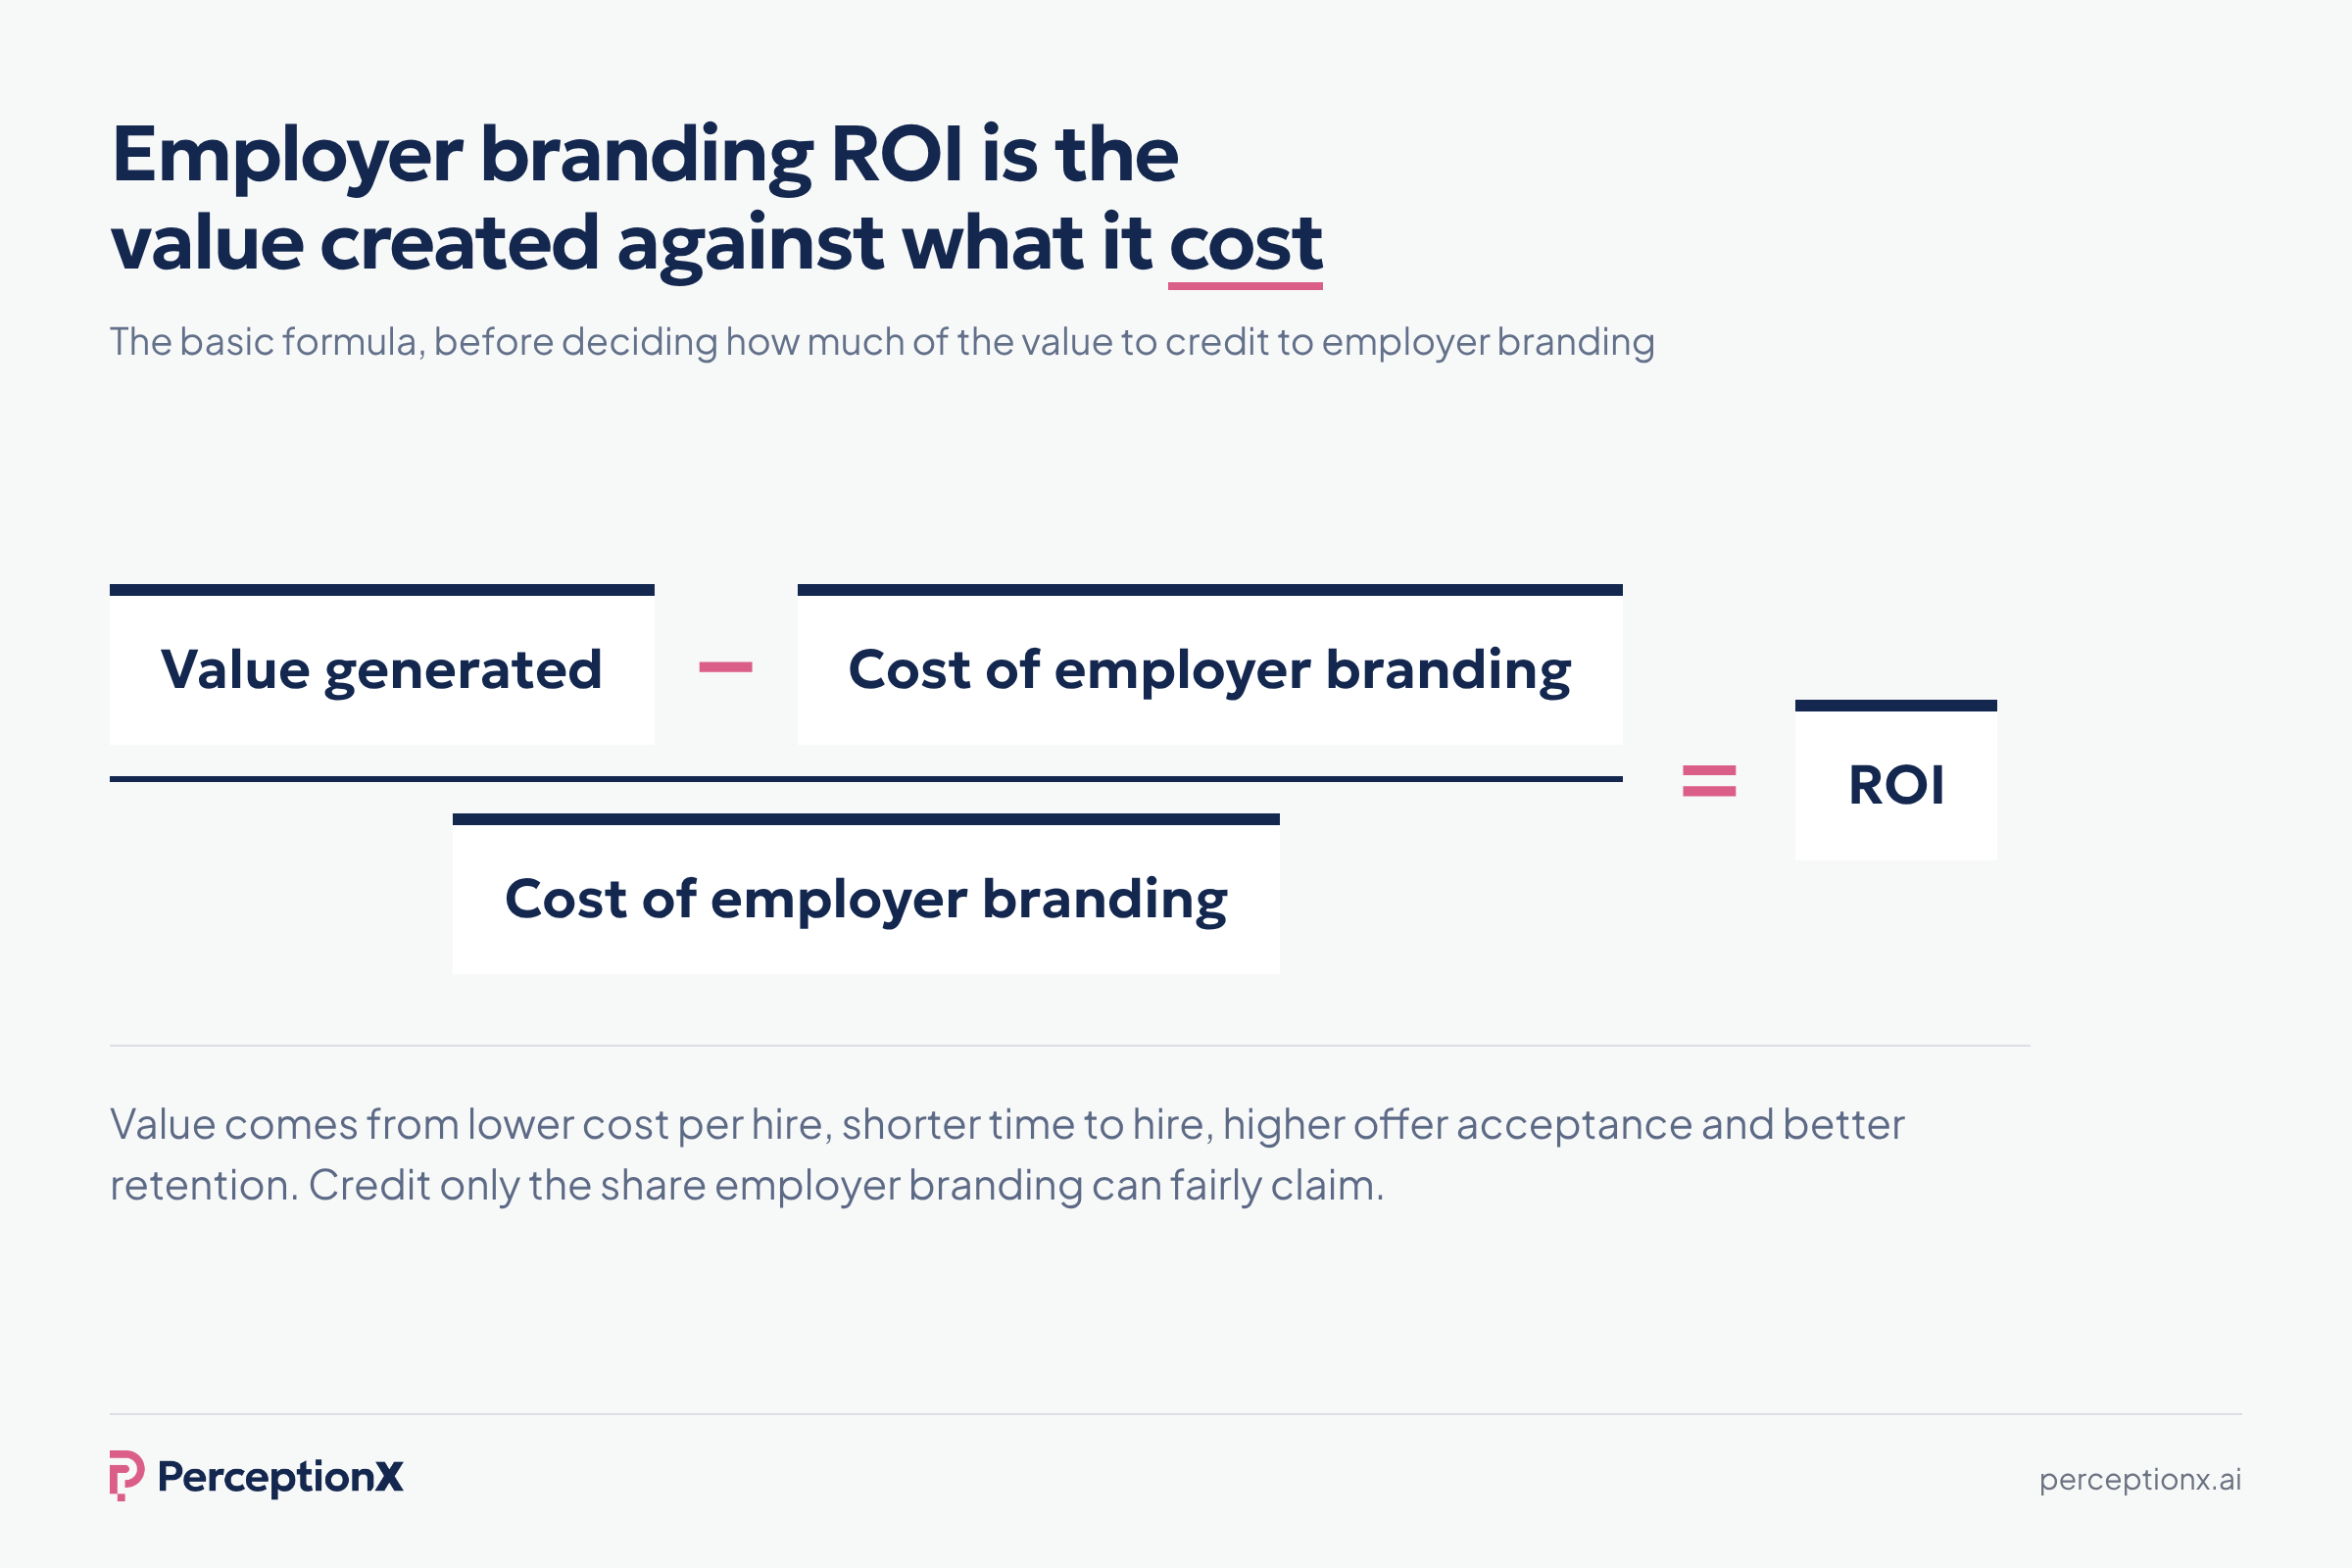
The employer branding ROI formula
The formula is the same one finance uses for any investment:
Employer branding ROI = (value attributed to employer branding, minus employer brand investment) divided by employer brand investment, shown as a percentage.
Three terms carry all the difficulty:
- Value. The financial worth of the change in each outcome metric against its baseline.
- Attributed. The share of that change you can reasonably credit to employer branding rather than to pay rises, a new applicant tracking system or a softer job market.
- Investment. The full cost of the work: people, agency fees, media, content production, technology and the time other teams contribute.
Finance will often ask for a second number: break even. That is the share of the total value that employer branding needs to have caused for the investment to pay for itself. It is frequently the more persuasive figure, because it turns an argument about attribution into a simple question: is it plausible that our work caused at least this much?
The inputs: which employer brand metrics feed the calculation
Choose a small set of outcomes that already have an accepted cost in your organisation. Our guide to employer branding metrics covers the full list; these five do most of the work in an ROI model. These metrics matter because each one already has a price inside the business.
| Input | What changes when the employer brand improves | How to turn it into money |
|---|---|---|
| Cost per hire | Fewer agency fees, less paid advertising per job post, more direct and referral hires | Change in cost per hire multiplied by the number of hires |
| Time to hire | Roles fill sooner because candidates already know and trust you | Days saved multiplied by the daily cost of a vacancy that finance accepts |
| Offer acceptance | Fewer declined offers and fewer restarted searches | Declined offers avoided multiplied by the cost of repeating the search |
| Quality of applicants | A higher share of qualified applicants per opening, so less screening per hire | Recruiter hours saved multiplied by the loaded hourly cost |
| Retention | Higher retention among new hires because the job matches the promise | Early leavers avoided multiplied by the replacement cost of the role |
Cost per hire
Cost per hire is total internal and external recruiting spend divided by hires in the period. Employer branding lowers it by shifting hires away from the expensive routes. When candidates come to your careers page directly, or through employees, you pay less in agency fees and job board spend. Track referral sources and the share of direct applicants alongside the headline figure, so you can show why cost per hire moved.
Time to hire and time to fill
Time to hire runs from application to accepted offer; time to fill runs from the approved vacancy to accepted offer. Both shorten when your target talent pool already has a view of you. The value is the cost of the vacancy: lost output, overtime, contractor cover. Ask finance for the figure they use. If none exists, agree one with them before you start, not after.
Offer acceptance
The offer acceptance rate is the clearest signal that your employer reputation is winning or losing against talent competitors. Every declined offer restarts part of the search. Record the reasons candidates give when they decline, because they show which part of the offer or the perception cost you the hire.
Quality of applicants
More applications are not a return. More qualified applicants are. Measure the share of applicants who pass screening, and the number of interviews needed per hire. Better fit candidates mean recruiters and hiring managers spend fewer hours per role, which is a cost you can price.
Retention
First year retention is where the largest sums usually sit. When the employee experience matches what candidates were told, fewer new hires leave, and the business avoids the replacement cost: recruiting again, onboarding again and the months before a new person is fully productive. Replacing a single employee costs a large share of their salary once all of that is counted, and more for senior or specialist roles. Strong employer brands lower turnover, because people join knowing what to expect. Employee engagement surveys, exit interviews and how employees feel about the promise they were sold all explain this number. Employee Net Promoter Score (eNPS), which measures employee advocacy and satisfaction, is a useful early signal: when current employees would recommend you as a place to work, new employees are more likely to stay. Workforce stability matters most to leadership in roles that are expensive to replace, so start there if you want to show how employer branding can reduce turnover.
How to measure employer branding ROI step by step
- Start with the business problem and the business goals behind it. Pick the hiring or retention problem leadership already cares about, such as engineering roles that stay open too long. ROI tied to business goals gets read; ROI tied to a dashboard does not.
- Set a baseline before you spend. Record each input for the same markets, job functions and business units you plan to work on. An employer brand audit gives you the perception baseline to sit beside it. Capturing the baseline rarely takes long, because most of the data already sits in your applicant tracking and HR systems.
- Agree the unit costs with finance. Vacancy cost per day, replacement cost per role, loaded recruiter cost. Use their numbers, not yours.
- Measure the change. Use consistent data: the same definitions, the same systems and the same segments, over several quarters rather than a single month.
- Attribute conservatively. Compare markets or business units that received the work with those that did not, and note what else changed. Then credit employer branding with a share of the value, not all of it.
- Subtract the full investment and present scenarios. Show a cautious, a central and an optimistic case, plus the break even point.
Our step by step guide on how to measure employer brand covers the perception side of this in detail.
A worked example (illustrative numbers only)
The figures below are invented to show the method. They are an example, not research and not a benchmark. Replace every one with your own data.
For example, imagine a company that makes 1,000 hires a year and spends 500,000 a year on employer branding, counting people, agency fees, content and technology. After a year of work in its priority markets, it sees three changes against its baseline:
| Input | Example change | Example value |
|---|---|---|
| Cost per hire | Falls from 5,000 to 4,600 across 1,000 hires | 400,000 |
| Time to hire | Falls from 50 days to 46, with finance pricing a vacant day at 100 | 400,000 |
| First year retention | Rises from 85% to 87%, so 20 fewer early leavers at a replacement cost of 30,000 each | 600,000 |
| Total value | All three changes together | 1,400,000 |
Pay rose in two markets during the same period and hiring volumes fell slightly, so the team does not claim the full amount. In this example it credits employer branding with half of the value: 700,000.
Example ROI = (700,000 minus 500,000) divided by 500,000 = 40%.
The same example under three attribution scenarios:
| Example scenario | Share credited to employer branding | Value credited | Example ROI |
|---|---|---|---|
| Cautious | 30% | 420,000 | Minus 16% |
| Central | 50% | 700,000 | 40% |
| Optimistic | 70% | 980,000 | 96% |
Break even in this example is about 36%: if employer branding caused at least that share of the improvement, the investment paid for itself. Note that offer acceptance is not counted separately here. Declined offers already show up in cost per hire and time to hire, so adding them again would count the same saving twice.
How to build the business case and show business impact to finance
An ROI figure is evidence. A business case is a request. Finance teams judge the second on a few things:
- Their own unit costs. Companies differ widely in what a vacancy or a leaver costs. A model built on finance's vacancy and replacement costs is hard to dismiss. A model built on figures from a vendor report is easy to dismiss.
- Scenarios, not a single number. A range with a break even point shows you understand the uncertainty.
- Leading indicators. Financial results lag. Show the perception and funnel measures that move first, so leadership can see progress before the savings arrive. This matters most when hiring slows and outcome data thins out.
- A link to business performance. Tie the request to a plan the business already has: a new site, a new market, a hard to fill job family.
- What happens without it. The cost of doing nothing is part of the case: open roles, declined offers and avoidable attrition continue at the baseline rate.
Keep the case to one page with the model attached. If you are setting next year's spend, our guide to the employer branding budget covers how to size and allocate it; this article is about proving what it returned.
Report like any other function that asks for money: the same measures, every quarter, including the quarters where nothing improved. Consistency builds more trust with leadership than one impressive slide.
Common mistakes that hide the real ROI of employer branding
- No baseline. Without a starting point there is no change to value. This is the most common reason an ROI claim fails.
- Claiming all of the improvement. Pay, the job market, new recruiters and new systems all move the same numbers. Attribute a share.
- Counting the same saving twice. Offer acceptance, time to hire and cost per hire overlap. Decide where each saving is counted.
- Measuring the wrong thing. Reach, likes and an overall rating on a review site are inputs. They are not a return, however good they look in a report.
- Leaving out costs. Salaries, employer brand content, marketing campaigns and the time of other teams all belong in the investment line.
- Judging a campaign by its reach. A campaign can win attention and still change nothing in hiring. Measure each campaign against the outcome it was meant to move, in the market it ran in.
- Measuring too soon. A new EVP, a recruitment marketing campaign or a rebuilt careers page takes time to show up in hiring and retention. Judge it over several quarters.
- Pooling everything. A company average hides the markets and roles where the work happened. Segment by market and job function, and by audience where it matters, such as young professionals or experienced engineers.
- Borrowing proof from elsewhere. Customer satisfaction, sales or share price may move with your company reputation as an employer, but you cannot credit them to your programme without evidence. Stay with outcomes you can trace.
Candidate experience is a frequent blind spot too. Our guide to candidate experience metrics covers the measures that explain why offers are declined.
Where AI answers fit in employer branding ROI
The same question now comes up in every ROI review: what moved the outcome? For a growing share of candidates, part of the answer is an AI assistant. In PerceptionX research with job seekers, 72% of AI-using job seekers used AI before deciding whether to apply, 82% said an AI answer changed their mind about a company as a place to work, and 58% caught AI giving inaccurate information about an employer.
That affects the calculation in two ways. First, it changes who enters your funnel. If ChatGPT or Gemini does not name you when candidates ask which companies to consider, or describes your pay and culture inaccurately, top talent drops out before any metric in your applicant tracking system can record it. Second, it gives you a leading indicator. What AI says about you changes before applications, offer acceptance and retention do, so it shows whether the work is landing months before the savings appear.
To include it, add an AI perception measure to your baseline and report it beside the financial inputs:
- Whether AI assistants name you when candidates ask about employers for your key roles.
- How positively they describe you, and on which themes: pay, culture, career growth, leadership.
- Whether what they say is accurate.
- Which sources shape the answer, such as Glassdoor, Indeed, LinkedIn, Reddit and your own careers page.
PerceptionX measures this. It tracks what AI tells candidates about employers across ChatGPT, Google AI Overviews, Google AI Mode and Perplexity, by market, job function and language, and brings it together in the Employer Perception Score. It also traces answers to their sources, so you can see which pages to improve and then measure employer brand impact as the answers change.
Measurement is only the start: every finding comes with recommendations on what to change, and practitioners who have measured employer brand for years help your team act on them.
Our scores are independent: they come from what AI actually says, not from what employers tell us.
In an ROI model, this is the evidence that connects the work to the money. A rise in perception among the candidates and roles you targeted, followed by a rise in offer acceptance in the same segment, is a far stronger case for business impact than either number alone.
Key takeaways
- Employer branding ROI is the value of improved hiring and retention outcomes, minus the investment, divided by the investment.
- Use a few inputs finance already prices: cost per hire, time to hire, offer acceptance, quality of applicants and retention.
- Set a baseline, attribute a share rather than the whole change, and present scenarios with a break even point.
- Report leading indicators, including what AI assistants tell candidates, so leadership can see progress before the savings arrive.
Frequently asked questions
What is employer branding ROI?
Employer branding ROI is the financial return on what a company spends building its reputation as an employer. It compares the value of better hiring and retention outcomes, such as lower cost per hire and higher retention, with the cost of the employer branding work that helped produce them.
How do you calculate employer branding ROI?
Take the value of the improvement in your outcome metrics against a baseline, credit a reasonable share of it to employer branding, subtract the full employer brand investment, then divide the result by that investment. Show the answer as a percentage, with cautious, central and optimistic scenarios.
How do you measure employer branding ROI without perfect attribution?
Set a baseline, compare markets or business units that received the work with those that did not, record what else changed, and credit employer branding with a share of the value rather than all of it. Then show the break even share, so finance can judge whether it is plausible.
What are some important metrics for employer branding ROI?
Cost per hire, time to hire, offer acceptance rate, the share of qualified applicants and first year retention carry most ROI models, because each has a cost that finance already accepts. Perception measures, including what AI assistants tell candidates, are the leading indicators that sit beside them.
How long does it take to see a return on employer branding?
Perception and funnel measures can move within a few months. Financial outcomes such as cost per hire and retention usually take several quarters, because hiring cycles and first year retention need time to play out, and the full return on employer branding builds over years rather than months. Report leading indicators in the meantime.
What is a good ROI for employer branding?
There is no reliable universal benchmark, because costs, hiring volumes and attribution methods differ between companies. A credible result is one that is positive under a cautious attribution scenario and improves against your own baseline over time.
Where do AI answers fit in the ROI of employer branding?
Many candidates now ask AI assistants about employers before they apply, so what those answers say affects who enters your funnel. Tracking whether AI names you, how it describes you and which sources it uses gives you a leading indicator to report beside the financial inputs.

Find out how AI is shaping your employer brand — and what you can do about it.